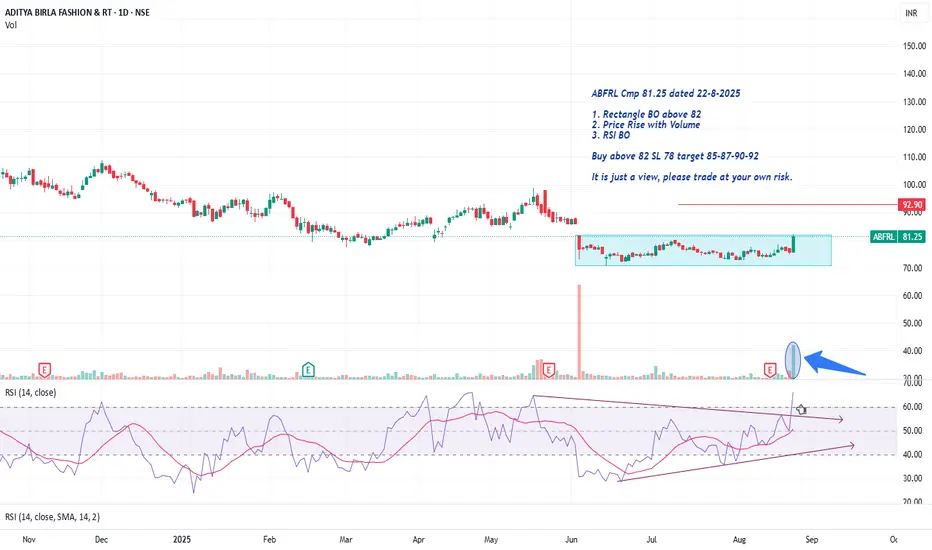
ABFRL Cmp 81.25 Price Rise with VolumeABFRL Cmp 81.25 dated 22-8-2025
1. Rectangle BO above 82
2. Price Rise with Volume
3. RSI BO
Buy above 82 SL 78 target 85-87-90-92
It is just a view, please trade at your own risk.
ABFRL trade ideas
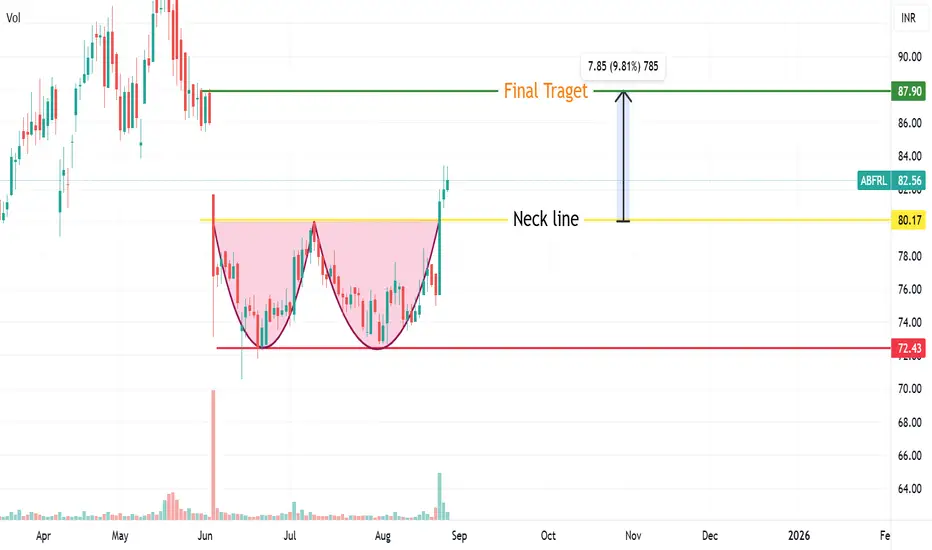
Aditya Birla Fashion Double Bottom pattern breakout Aditya Birla Fashion formed Double Bottom pattern & given breakout form Neck line ,Possible target of it will be arround 87 level ,One can keep a stoploss 78.5 Rs level .
its not a buy or sell call ,For educational purpose .
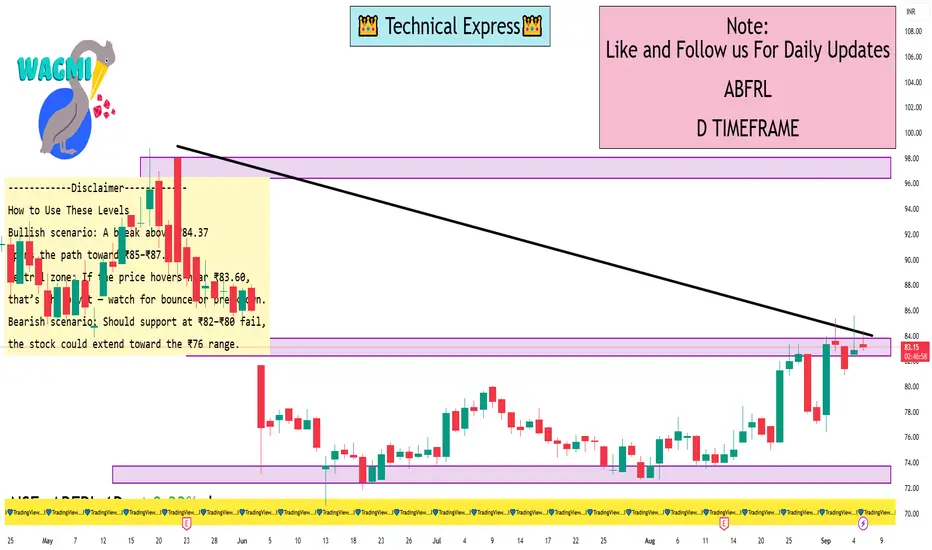
ABFRL 1 Day ViewKey Intraday Support & Resistance Levels (1-Day Timeframe)
Here’s a breakdown of the technical levels for ABFRL on a daily (1-day) timeframe:
Pivot Points & Fibonacci Levels (TopStockResearch as of Sept 5, 2025)
Standard daily pivots:
Support: S1 = ₹83.59, S2 = ₹81.59, S3 = ₹80.29, S4 = ₹78.29
Pivot: ₹84.89
Resistance: R1 = ₹86.89, R2 = ₹88.19
Camarilla pivots confirming nearby support/resistance zone
MunafaSutra Intraday Levels
One source reports:
Resistance: ₹78.09
Short-term support/resistance: ₹80.24 / ₹76.48
Another indicates:
Resistance: ₹77.42
Support/resistance: ₹78.26 / ₹75.82
These shorter-term numbers appear based on earlier data and may have shifted slightly. The pivot-based levels from TopStockResearch are likely more up-to-date and relevant for today’s intraday outlook.
Fibonacci Retracement Levels (from recent uptrends)
Retracement (support) zones from trend beginnings (e.g., June 13–Sept 4):
Near support areas: ₹79.85, ₹78.07, ₹76.30, ₹74.10
Projection (resistance) levels: ₹86.43, ₹88.63, ₹90.40, ₹92.18, ₹94.38
Gap Resistance & Candlestick Patterns
A gap resistance zone exists around ₹84, which may act as a near-term target if bullish momentum continues. Recent candlestick activity (inverted hammer, bullish pin bar) hints at potential short-term reversal strength
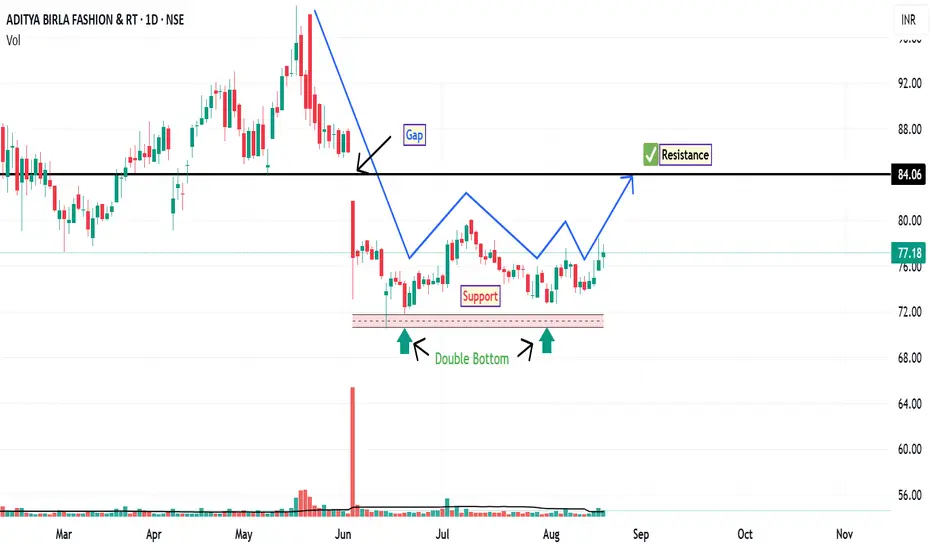
ABFRL: Price Action OverviewFollowing a gap-down opening on June 4, ABFRL entered a consolidation phase, trading within a well-defined supply and demand zone. This range-bound movement suggests a period of accumulation or indecision among market participants. During this consolidation, the stock has formed a double bottom pattern on the daily chart—a classical reversal structure that often indicates a potential shift from a downtrend to an uptrend, provided confirmation follows.
An inverted hammer appeared near the second bottom, signaling potential buying interest at lower levels. This was followed by a bullish pin bar, reinforcing the possibility of a short-term reversal. These candlestick formations, especially when occurring near support zones, can be interpreted as early signs of bullish momentum returning—though follow-through price action is essential.
If bullish momentum sustains than the stock may attempt to fill the gap left from the June 4 session. The gap resistance level is around ₹84 , which could act as a near-term target for traders monitoring this setup.
Disclaimer: This analysis is for educational and informational purposes only. It does not constitute investment advice or a recommendation to buy, sell, or hold any security. Always conduct your own research or consult a licensed financial advisor before making investment decisions.
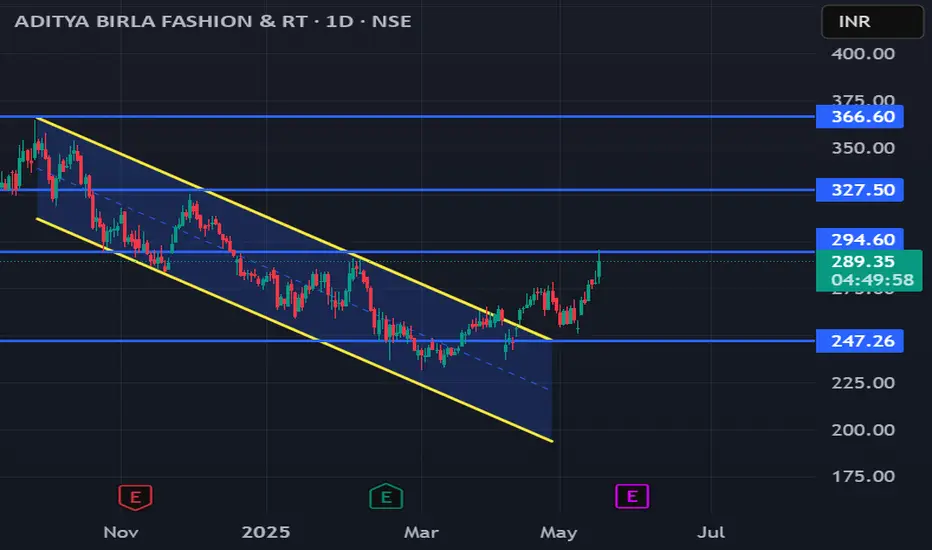
ABFRL: Channel Breakout & Retest Above 300Details:
Asset: Aditya Birla Fashion & Retail Ltd (ABFRL)
Breakout Level: 300
Potential Targets: 325, 360
Stop Loss: Below 290 or as per risk tolerance
Timeframe: Short to medium-term
Rationale: ABFRL has broken out of a channel and completed a successful retest around 300. This indicates a strong bullish reversal with potential for continued upward movement.
Market Analysis:
Technical Setup: Channel breakout with retest adds conviction to the bullish case.
Sector Outlook: Retail sector remains strong with rising consumer spending and expansion plans from major players like ABFRL.
Risk Management:
Suggested stop loss below 290 to manage downside risk.
Timeframe:
Short to medium-term upside towards 360, contingent on continued strength.
Risk-Reward Ratio:
Favorable setup with low risk and decent reward potential.
Watch for strong volumes above 305 to confirm next leg of the rally.
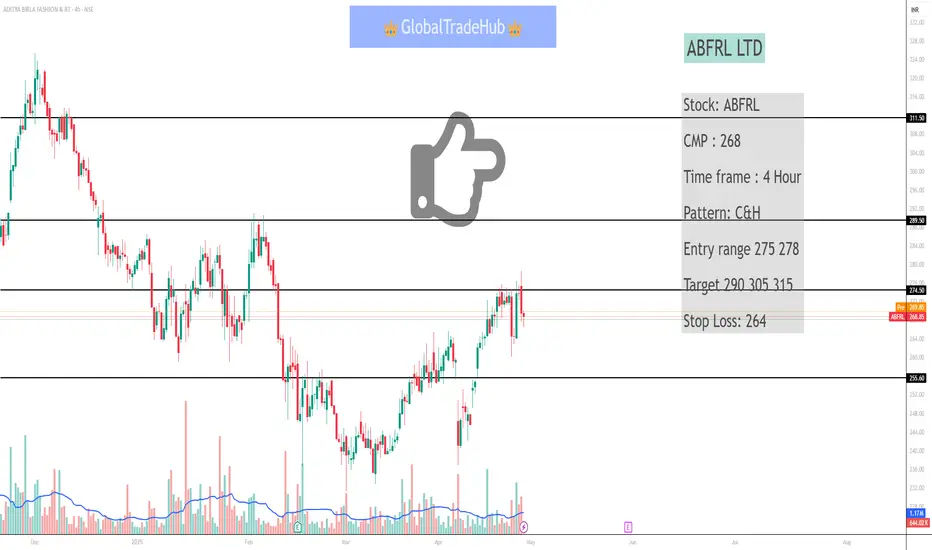
ABFRL LTDABFRL LTD
I'm not a SEBI - Registered advisor. All the information provided is for educational and information purposes only.
Note- This is not buy/sell recommendation, before investing discuss with your financial adviser
Stock: ABFRL
CMP : 268
Time frame : 4 Hour
Pattern: C&H
Entry range 275 278
Target 290 305 315
Stop Loss: 264
#ABFRL
ABFRL - BreakoutABFRL have breakout and ready to move up.
Stock was trading in the bullish flag and it has given the breakout.
Initial target is 285, once sustain above this we can see 340-360+++.
Good to hold for the long term.
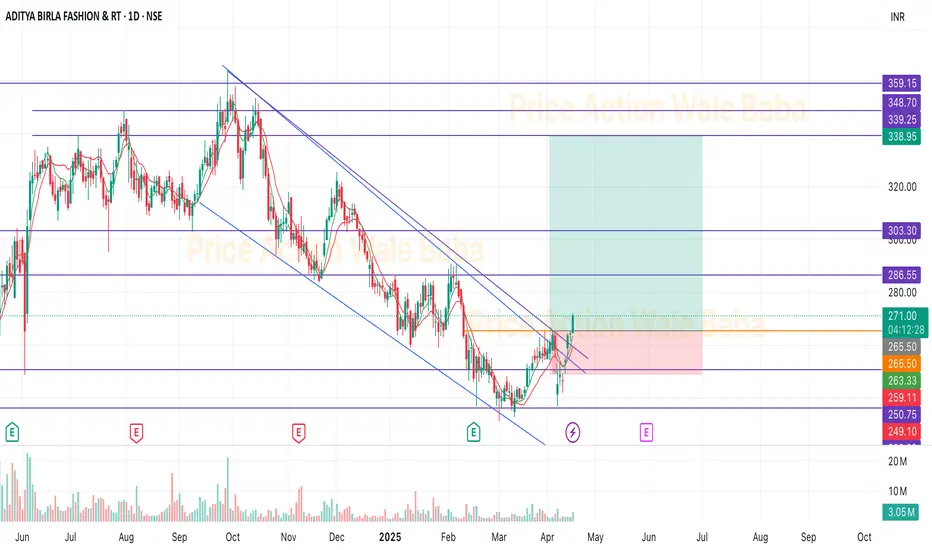
ABFRL - Expecting more fall from this point nowAs expected & explained in my Jan 22nd analysis that stock would not go upside beyond 288
It tried twice but finally resisted and fell
And while falling it now broke important support area near 260-62
So now when its pulling back, it is expected to repeat previous pattern and resist the area of 260 - 62
As it is now the new resistance as well as the flip zone, so the changes are very high
Downside 1st stop can be expected at 250 at the least, further will update, when time arrives

Aditya Birla Fashion and Retail LtdDate 30.01.2025
ABFRL
Timeframe : weekly chart
Remarks : Probability of risk reward is high on Buying
At combination of multiple legs of seaport such as ;
200 Weekly exponential moving average + Rising channel base line + 61.8% of Fibonacci retracement + Previous right angle ascending wedge neckline + support base therefore stoploss also becomes very very critical.
In case of breaching of mentioned above would be best for shorts.
Or for patience after breaching multi leg support factors allow it resume above those & enter for short term.
Regards,
Ankur

ABFRL - Bearish Idea !Stock reaching near its resistance as well as flip zone of 282 - 88
Area is a valid supply zone
Any pull back in the area may push the stock further down again up to 262 to 250 this time
Valid stop loss for upside may be 290
Will wait for sell signal in lower time frame (1 hour or so)

abfrl next target 383 as elliotwave showsabfrl next target 383 as elliotwave shows. we counted the elliotwaves and find out the bullish target for abfrl. you can buy with target of 383 and stoploss 250

a breakout soona good bottom fishing done and lagging span entering the zone,,,a good breakout for 20% up soon on watchlist

a breakout soona good bottom fishing done and lagging span entering the zone,,,a good breakout for 20% up soon on watchlist

ABFRL consolidation breakdown to keep on radarAditya Birla Fashion and Retail Ltd. another consolidation breakdown to keep on radar
1. Price made false / failed breakout of the consolidation zone earlier
2. Price now made a consolidation breakdown on weekly chart
3. RSI on daily chart below 40
4. Double top visible on charts
5. Cypher Pattern under formation on weekly chart
Lets See How it Evolves.
Disclaimer: NOT A BUY / SELL RECOMMENDATION I am not an expert I just share interesting charts here for educational purpose and not to be taken as buy/sell recommendation. Please seek expert opinion before investing and trading as trading/ investing in market is subject to market risks. I do not hold any position in the stock as on date but I may look to take some position with my own Risk Reward matrix.

Harmonic pattern Harmonic pattern forming when price meet Fibonacci level 1.61% crating bullish crab pattern

Turning Bullish: Aditya Birla Fashions Retail Ltd. (ABFRL)ABFRL has been in range bound between 309 and 324.
It has strong resistance around 343.
It tried to break the resistance 343 levels in July24. However, the volume level failed the breakout.
Historically, the price of ABFRL peaked in OCTOBER months.
If the current bullish trend continues, we can expect ABFRL to break 324 levels and exceed 360 levels.

Aditya Birla Fashion & Retail (NSE: ABFRL) – Price Volume ContraThe stock has been in a range-bound consolidation between ₹330 and ₹355 for over three months and is showing signs of a potential breakout:
Price Volume Contraction: The price has been tightly consolidated with lower volume, indicating a reduction in volatility. A breakout with increased volume could signify a strong move.
Moving Averages: The stock is well-supported by the 50-day and 100-day moving averages, which are trending upwards, adding bullish momentum to the setup.
RSI (14): The RSI is currently around 65, signaling strength and further potential for an upward breakout without being in overbought territory.
Resistance: The stock has recently tested the resistance at ₹354 multiple times, and a close above this level could lead to a breakout with significant upward momentum.

ABFRL CUP AND HANDLE BREAKOUT- broken the cup and handle trendline
- volume also has increased
- 1:4 risk reward
This analysis is my own idea.
I don't recommend taking trade based on this idea.
consult your SEBI registered adviser to Know the market risk before trade.
in.tradingview.com

ABFRL - Cup Breakout ABFRL looking strong Cup Breakout !!
Height of the cup : 175 point
breakout Zone : 360
Target : 535
Time Frame : Medium Term
Return : 50%

ABFRL - Cup Breakout ABFRL looking strong Cup Breakout !!
Height of the cup : 175 point
breakout Zone : 360
Target : 535
Time Frame : Medium Term
Return : 50%


Aditya Birla Fashion & Retail Ltd (ABFRL). STOCK ANALYSIS
Aditya Birla Fashion & Retail Ltd (ABFRL). Below is an analysis of the chart:
Key Observations:
Price Movement:
The stock experienced a correction of 39.75 INR (11.46%), followed by a recovery of 36.90 INR (10.63%).
The current price of the stock is around 343.30 INR.
Recent Recovery:
After the 11.46% decline, the stock has bounced back, gaining 10.63%, indicating renewed buying interest. This suggests a recovery after a dip.
Support and Resistance:
The support level appears to be around the 300-320 INR range, where the price found support during the decline.
The resistance level is around the 360-370 INR range, where the previous rally saw some selling pressure.
Volume and CVD:
The CVD (Cumulative Volume Delta) indicates negative numbers, suggesting selling pressure in recent sessions. This may signal that the stock needs more volume or buying power to break above current resistance.
Outlook:
If the stock breaks the 360 INR resistance, it could see more upside momentum, but if it faces selling pressure, it may revisit the support zone.
Conclusion:
The stock is in a recovery phase after an earlier decline, but there is resistance ahead. Breaking the resistance around 360-370 INR could lead to further gains.
Monitor Volume: To confirm bullish strength, an increase in buying volume would be crucial.

ABFRL - Breakout Possibility - Long termABFRL : Long term view
Cup and handle breakout in progress
Need to sustain above 355 levels (earlier rejections) for a strong breakout
