ACC trade ideas


Symmetrical Triangle and Parallel ChannelGo long after it breaks the triangle.
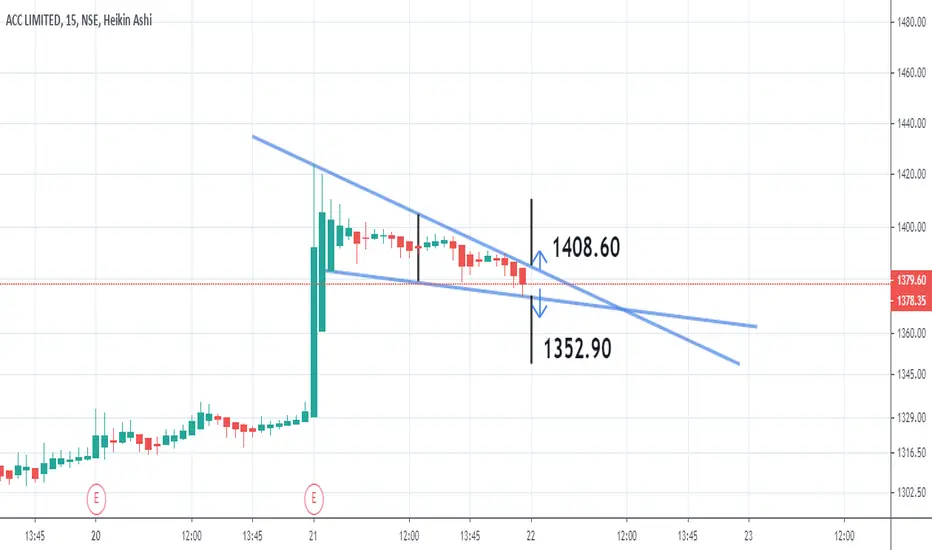
1. It is traded in the parallel channel, taking support downside should touch the upper channel.
2. Centerline is around 1400 which should be our target 1.
3. RSI near 60 range.
4. Good green volume to be considered.
5. After a long time, it left 10 SMA.
6. OI is build up fo Long

ACC 23rd July 2020 trade setupWe can see a good movement on ACC tomorrow .
Buy side
If crossed 1376 it's resistance level and sustain we can see a good movement on upper side 1390 or 1400 plus will be a target.
Sell side
if not sustain on support level which around 1359-1350 see big downside movement target would be 1360/1355/1350/1340/1335
Sideways
if any case sideways than movement between 1360-1380 but as per my understanding possibilities are very less.
If case of gapup & gapdown targets will be same.
Note- As of now based on RSI, upside side movement possibilities high.
Pattern- Double bottom pattern can seen on 5 min chart.


ACC CEMENT LTD ACC CEMENT LTD
Acc has been running in the parallel channel for quite some time, expecting it to touch the center line which is around 1400,
a major hurdle has been around 1341 if break then will touch easily by 4-5 sessions
If you want me to post more and more charts, please don't forget to like and subscribe I shall be posting for you all.
Do leave a comment if you have a query, I shall revert back to you soon
Thank you


Visual Interpretation Professionals Always have an Alternative view along with in the course view ,
My previous view on this scrip is Negated as this has been paused and creating Corrective moves both in inter-day and daily prospective
Now my alternative view on this is it will make all time New High as a long term Forecasting ,
Mean time the trend has entered in corrective move which is time consuming pattern or we Professionals call it function of time ,
One can Expect simple move as per forecast with in the correction as a , b , c , Now i always consider 1st priority as simple interpretation
if there is change in the pattern with in correction then the secondary trend ( Corrective patterns) will be complex and more puzzling patterns ,
Now lets consider simple and Expect the move to be in this visual information , any change i will update on weekly basis
Look for proper set up in this range bond pattern for trading
Good luck


Figuring out direction of a stock ft. ACCLook for any previous pattern and see how the stock reacted.
We have a Flag Pattern (in a blue dotted line) which was executed very theoretically. It also gave us an idea of the direction of the stock. (This won't always be precise although)
The stock went into an Ascending Triangle Pattern after that and is close to giving a Break-out/down.
We have not more than 3 probabilities here.
The stock either goes up, goes down, or goes sideways.
But then that's the story of the markets. What is the need of studying these chart patterns?
Chart Patterns & Indicators only help with increasing the probabilities of a possibility.
and they still won't work 10-20% of the time. But that's where all the risk lies. In betting against a probability which is more favorable to you.
Now ACC has increased its probability of giving a breakout.
1. Flag Pattern
2. Ascending Triangle Pattern
Indicators aren't indicating anything at the moment.
That's why we have Thresholds to give a clear signal before executing our trade.


ACC LTD on bullish trendBuy ACC stock @ level of 1282 For next target price of 1295. The stock in bullish trend & taking the support of 1280.
Always do trading as per your Reward to Risk ratio means Never risk more than you can afford to lose on a single trade. Please keep patience & wait for the levels means Sit and wait for the right opportunity. Request to like & follow for more such ideas of technical analysis learning.The idea sharing is for educational purpose only. In case any suggestion advice required feel free to ask .


What To Do with ACCIf we ACC chart on Daily it does have sell signal around 1300 level on BB crossing the middle line so now what to do with it now as per my analysis all we can able to see a rising trend line on NSE:ACC on 1250 and previously multiple time tested horizontal support and resistance line at 1240.
Point One:- if we see intraday 60min chart where a short of reversal candle can be seen which does have some sup or stop area for the reversal at 1240-1248 With Tp-1280
Point Two:- If Short is done already around 1300 level trail your stop -1282 or closed now 1255-60 and done fresh sell below rising support line on daily closing basis with Tp1-1225 TP2- 1180 Stop will be 1283 trailing stop-1250
Note : Its not so easy to break that long term rising support line


Special Webinar Noise less charting & Building Confidence One can view the video , I am sorry i have to cut short the video as I was running out of time , if you have Questions then Let me know I will try to address it
if you do not understand repeat the view for at least 3 time and try practicing for 2 days on random scrip , You will get some insights
Good luck


