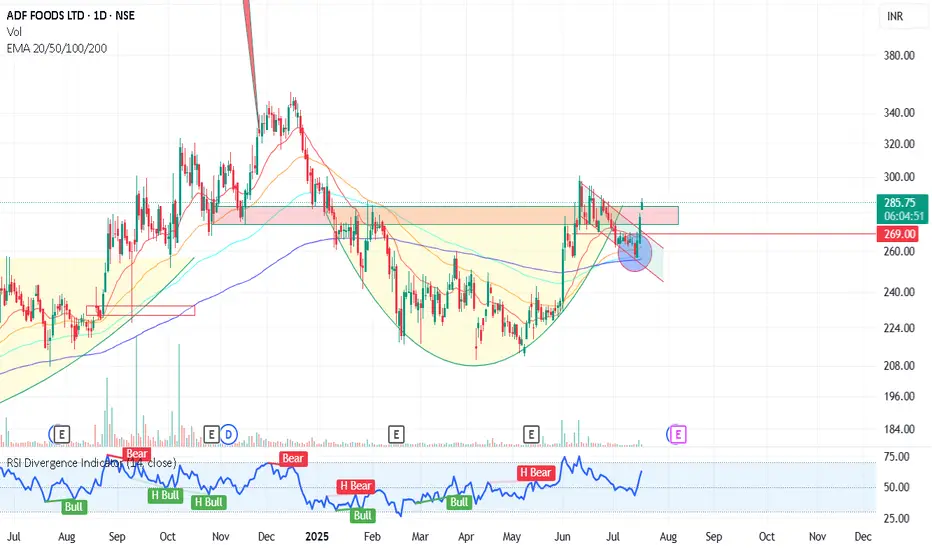
C&H Breakout ADF foodClear Cup & Handle breakout seen on chart
Volumes are strong
Price is crossing over last breakout level 283
if price sustain over the 285 , the price could retest the latest swing high 301 and surpass accordingly.
Keep on watch!!!
This is not for any trade recommendation, only educational purpose
Trade ideas
BUY TODAY SELL TOMORROW for 5% By Kapil-MittalDON’T HAVE TIME TO MANAGE YOUR TRADES?
- Take BTST trades at 3:25 pm every day
- Try to exit by taking 4-7% profit of each trade
- SL can also be maintained as closing below the low of the breakout candle
Now, why do I prefer BTST over swing trades? The primary reason is that I have observed that 90% of the stocks give most of the movement in just 1-2 days and the rest of the time they either consolidate or fall
Consolidation Breakout in ADFFOODS
BUY TODAY SELL TOMORROW for 5%

ADF FOODS - DOUBLE BOTTOM - 2HR CHART.ADF Foods is making Double Bottom pattern. It is in buying range.
Hammer candle formation at an old support, RSI divergence. Below 270 it looks weak.
If you like my analysis, please follow me as a token of appreciation :)
in.tradingview.com/u/SatpalS/
For learning and educational purposes only, not a trading advice. Pls consult your financial advisor before investing.

ADFFOODS - Double Bottom Pattern Breakout on Daily ChartADFFOODS - Double Bottom Pattern Breakout on Daily Chart
After giving a good rounding bottom base breakout, the stock is moving up by forming some patterns like Darvas Box pattern and Double bottom pattern.
Currently, it has give a double bottom breakout with massive volume indicating more possible upsides.

ADFFOODS BEAKS OUT FROM 1-YR BASE RESISTANCE TO NEW HIGHADFFOODS, on the weekly scale, has just broken out from a 1-year base resistance on strong volume and is trading at new high. This week its momentum (RSI) moved into bull-zone above 60 and is rising. Its relative performance to CNX 500 crossed above its 26-week MA, and started making Higher-Highs & Higher-Lows. AS the breakout is strong, we can see some significant rally in the counter.
On fundamentals, it has an annual revenue growth of 15%, pre-tax margin of 19%, EPS growth of 17%, and is debt free. Its annual EPS has been rising since 2017. Over the last 8 quarters both sales and EPS have been rising Q on Q. Number of funds invested in the stock as well as number of shares held by funds have increased during the last quarter.
No recommendation. Only personal analysis for educational purposes. Please consult your financial advisor for any investment, or buy or sell decisions in the financial markets.

ADF FOODS near Breakout Zone; Will it Breakout or consolidate ?ADF Foods Ltd. is an interesting chart with following
1. Price consolidating for last 11 month's and is near breakout levels.
2. RSI on all time frames above 60
3. Narrowing Bollinger Bands with price walking on upper Bollinger Band
4. Price Rise with huge Volume bars
5. Major Support near 215- 228 zone being cluster of moving average supports.
A stock to keep on Radar ; A Consolidation ;
Will it breakout or continue consolidating ?
CAUTION : RSI Negative Divergence visible on charts
Lets See How it Evolves.
Disclaimer: NOT A BUY / SELL RECOMMENDATION I am not an expert I just share interesting charts here for educational purpose and not to be taken as buy/sell recommendation. Please seek expert opinion before investing and trading as trading/ investing in market is subject to market risks. I do not hold any position in the stock as on date but I may look to buy on dips with my own Risk Reward matrix.

Adffoods, Marathon, Zentech, Zeemediaall stocks looking good from here,,
2 flag base
and 2 long base setups

ADF FOODSI Observed these Levels based on price action and Demand & Supply which is My Own Concept Called "PENDAM CONCEPTS" ... Please Don't Take any trades based on this chart/Post...because this chart is for educational purpose only not for Buy or Sell Recommendation.. Thank Q

Long ADF FoodsADF Foods Ltd is showing strong bullish signals on the weekly chart:
Price Action: The stock has been in an upward trend since May 2023, recently breaking above the key resistance at INR 220, indicating strong momentum.
Moving Averages: The 10-week EMA has crossed above the 20-week EMA, forming a bullish crossover, with the current price trading above both.
Support and Resistance: The new support level is INR 220, with the next resistance at INR 261.95. The profit target is set at INR 300 for a 30%+ gain.
Volume: Increased volume on the price surge suggests strong buying interest.
RSI: Currently at 58.44, indicating room for further upward movement.
Company Overview: ADF Foods Ltd is a leader in food processing, with a strong domestic and international brand presence.
Revenue Growth: Consistent revenue growth driven by product expansion and new market entries. Recent earnings reflect strong demand.
Profit Margins: Maintains healthy margins through efficient cost management and high-margin products.
Market Position: Strong market position with effective brand visibility and customer reach.
Expansion Plans: Actively expanding production capacity and distribution network, driving future growth.
Management: Proven leadership focusing on innovation, quality, and customer satisfaction.
Trade Setup:
Entry: Ideal entry at INR 228.51, with an additional opportunity at INR 220.
Stop Loss: Set at INR 200-195.
Target: INR 300, a 30%+ increase.
Conclusion:
ADF Foods Ltd is a strong buy with bullish technical indicators and solid fundamentals. Enter at the current price with a defined stop loss and profit target to manage risk effectively.

ADF Foods- Typical RB with Flag patternADF Foods- Typical RB breakout along with flag formation later on. Flag pattern breakout done on 22.03.2024. Currently at resistance. Weekly candle close above 232 will ensure the target of 300.
Team Stocks-n-Trends.
Note: This is for educational purpose only.

RB breakout done but flag formation going onRB breakout done but while retracement it formed a flag pole pattern for which the breakout is pending for the target mentioned in green colour.
Team Stocks-n-Trends
Note: THis is for educational purpose only.


ADFFOODS - Gearing up for a launch?After consolidating Near ATH for almost 2months.
Is it a D-Day for this rocket to launch?


Price Squeeze after uptrend📌Stock for the day
🚀Keep an Eye
#ADFFOODS
- Price Squeeze after uptrend
- Volume dryup
- Above Key EMAs
- Bullish RSI

A long term resistance breakout, can give good upmove from hereTarget 1300, 1130 and SL 850.. A bit deeper SL so adjust position size

buybuy abv 765.50 stop loss 744 target 2 times of risk.
Dsic : It's not an invesment advise to buy or sell. Do you research.

ADF Foods Limited ADFFOODS:- move upside by giving breakout from the trendline and retesting, Watch the stock...
Hello traders,
As always, simple and neat charts so everyone can understand and not make it too complicated.
rest details mentioned in the chart.
will be posting more such ideas like this. Until that, like share and follow :)
check my other ideas to get to know about all the successful trades based on price action.
Thanks,
Ajay.
keep learning and keep earning.

ADFFOODS- Symmetrical Triangle PatternNSE:ADFFOODS
1. Breakout in Symmetrical Triangle Pattern
2. Strong Volume and price formation between the narrow range 680 too 770
3. Upcoming levels to watch 960 to 1080
4. Support near 760 level.
#TechnicalAnalysiswithMrChartist


I have no idea what pattern is this can some one see it. I thinkNSE:ADFFOODS
ok the trend is down trend but it made a flag type of pattern .


Don't miss ✌✌✌This scrip has been for short Term and Low risk set up and it is expected to move upside in the coming days. So traders keep on your watchlist and try to catch the momentum. Thanks to all 🙏🙏🙏
