Ajantha pharma short&mid term view- BullishDaily and weekly indicators(MACD,ADX,CCI,RSI,PSAR) are showing positive signals. Daily ADX moving positive,Daily&weekly CCI positive crossover,weekly MACD cut may happen on upcoming weeks.These factors will help to achieve the target levels. Please refer chart for other details.
Vijayaraghavan.K,
Kovilpatti.
Ajanta Pharma Limited
No trades
Trade ideas

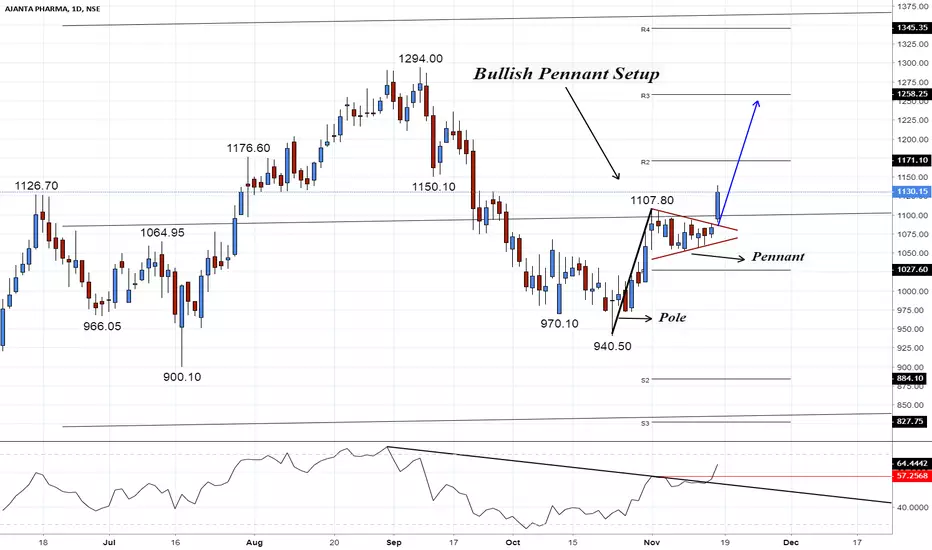


Trade No-8Ever thing mention on chart
For more clarification write in comment Box.
Test your brine
Life is 10% what happens to you and 90% how you react to it.


Possible Interruption This one might Go back to retest the top , watch out when it drops to 1057/1050 it might slow down and reverse
if fails to stop then Look for continuation till 884,

AJANTA PHARMA LTD : DOUBLE BOTTOM1. ENTRY : Closing Above 1126.70 ( Closing above the Neckline )
2. Minimum Price Target : 1350 ( Adding the difference between highest high made and lowest low during the formation to The Neckline )
3. Stop loss : 900 (Usually, price closing below the second bottom is a stop-loss.)
Only Problem While treading Double Bottom is it's having a 1:1 Risk Reward Ratio, When Minimum Price Target reached. So apply your money management wisely.
For Example : If you wanna Risk 5000 as a Maximum loss then Trade, Risk Amount / Stop loss Points = Quantity to be traded.
5000 Risk Amount / 226 Stop loss in Rs. = 22 Shares to be traded to Earn apx 5000 as Profit.
Statistics says that 70% of Double meets predicted price targets.
Assuming 10 trades.
7 wins = 7*5000 = 35000
3 loss = 3*(5000)=(-15000)
Net Profit After every 10 calls will be 20000.
As said earlier because Double Bottom Reversal Pattern having a 1:1 Risk to Reward ratio Need to Pick trades carefully.
Always Keep your Risk Profile low When you have RR less then 1:2.


Initiate a Short Trade on AjantaPharmaInitiate a Short trade on AjantPharm, from 1220, SL @ 1235, Targets (1) 1200, (2) 1185, (3) 1167, (4) 1135, (5) 1121, (6) 1110

Buy AJANTA PHARMAStock is showing positive signs at support. It may breakout at around 1380 to give much better levels


Ajanta Pharma Bounce Uptrend TradeEntered on 8th August 2018 on 1174.95 with a stop loss at 1130
TSL update on 14th Aug 18 from 1130 to 1132.15
Current Trailing Stop loss = 1132.15
In case of hitting stop-loss loss of 42.8 points.

ajanta pharma uptrendbuy at breakthrough keeping target at resistance 1 and stop loss as your appetite
if it breaks resistance 1 go long

AJANTA_PHARMA Bounce Uptrend TradeEntered on 27 Jul 18 on 1077.85 with a stop loss at 1029
TSL 0.00% 0.00% 0.00% update on 8 Aug 18 from 1029 to 1130
TSL 0.00% 0.00% 0.00% update on 14 Aug 18 from 1130 to 1132.15
Current Trailing Stop loss = 1132.15
In case of hitting stop loss confirmed profit of 54.3 points


AjantaPharma Bounce Uptrend TradeEntered on 27 Jul 18 on 1077.45 with a stop loss at 1026.80
TSL 0.00% update on 07 Aug 18 from 1026.80 to 1127.15
Current Trailing Stop loss = 1127.15
In case of hitting stop loss confirmed profit of 49.70 points.

Ajanta Pharma Bounce Uptrend TradeEntry at 1077.85 on 27 july with SL at 1027.3
TSL updated at 1130 on 8 aug.
TSL updated at 1132.15 on 14 Aug
If stop hits, confirmed profit of 54.3 pts


short stock is making B or 2 (50% retracement of wave 1 or B)
EXPECTING a short opportunity near 1250
only for educational purpose
