AMBER Price ActionAmber Enterprises India (AMBER) detailed price analysis as on October 7, 2025:
- The stock is trading near ₹8,172 to ₹8,175 levels on BSE and NSE with a slight decline of about 0.49% compared to the previous close.
- The day’s trading range was between ₹8,054.6 (day low) and ₹8,240.5 (day high) on
Next report date
—
Report period
—
EPS estimate
—
Revenue estimate
—
81.30 INR
2.44 B INR
99.11 B INR
20.69 M
About Amber Enterprises India Ltd.
Sector
Industry
CEO
Jasbir Singh
Website
Headquarters
Gurugra
Founded
1990
ISIN
INE371P01015
FIGI
BBG00JQ7FM45
Amber Enterprises India Ltd. engages in the manufacture of home appliances equipment. The firm operates through the following Divisions: Consumer Durables Division; Electronic Manufacturing Services Division and; Railway Subsystems & Defence Division. The Consumer Durables Division comprises RAC finished goods, room AC components including motors, and nonroom AC components, symbolising commitment to product diversity and innovation. The Electronic Manufacturing Services Division comprises ILJIN Electronics, EVER Electronics and Ascent Circuits, delivers cutting-edge solutions to various segments of industries viz. telecom, automotive, smart energy meters, consumer electronics and appliances, hearables, and wearables & bare board PCBs, demonstrating technological prowess and adaptability. The Railway Subsystems & Defence Division provides integrated solutions to rolling stock customers, including Indian Railways, Metro, RRTS, buses and Defence, where it offer customised solutions in HVAC, doors, gangways, and pantry systems. The company was founded by Kartar Singh on April 2, 1990 and is headquartered in Gurugra, India.
Related stocks
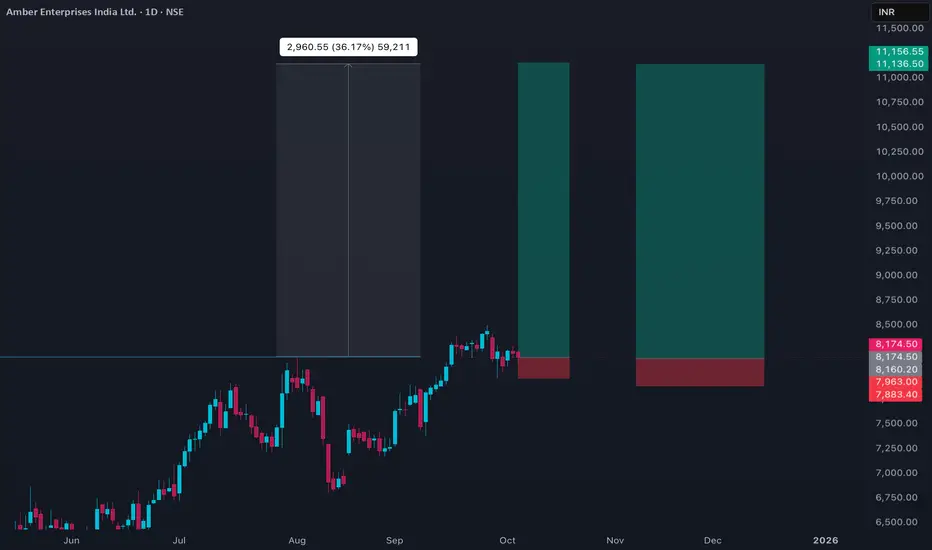
Amber Enterprises Amber Enterprises is showing a strong breakout above the resistance zone with higher lows formation 🔥📈. Support around 7800, resistance near 8600. Momentum looks bullish

AMBER - Breakout from the resistanceAmber Enterprises India is seeing a strong breakout with the stock rising over 1.8% to ₹8,080 on high trading volumes of around 3.6 lakh shares recently.
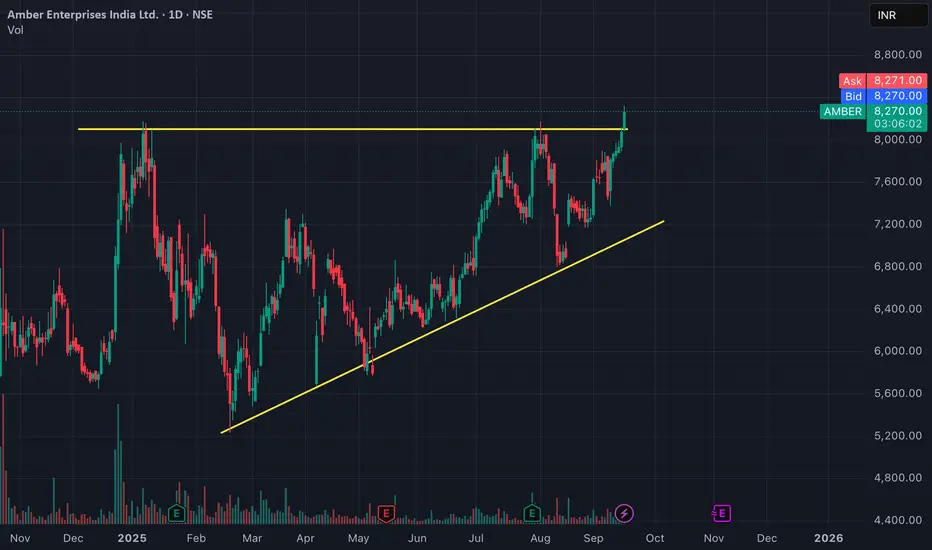
Breakout Soon in Amber EntAbout 8 + months of consolidation Amber Ent is forming a classical Ascending Triangle Breakout Pattern. The RSI is above 60 and the stock is gaining momentum. Keep in your watchlist
Breakout Setup:
Ascending Triangle Breakout Pattern
RSI above 60
Trading above EMA50
Volume increasing
8+ months

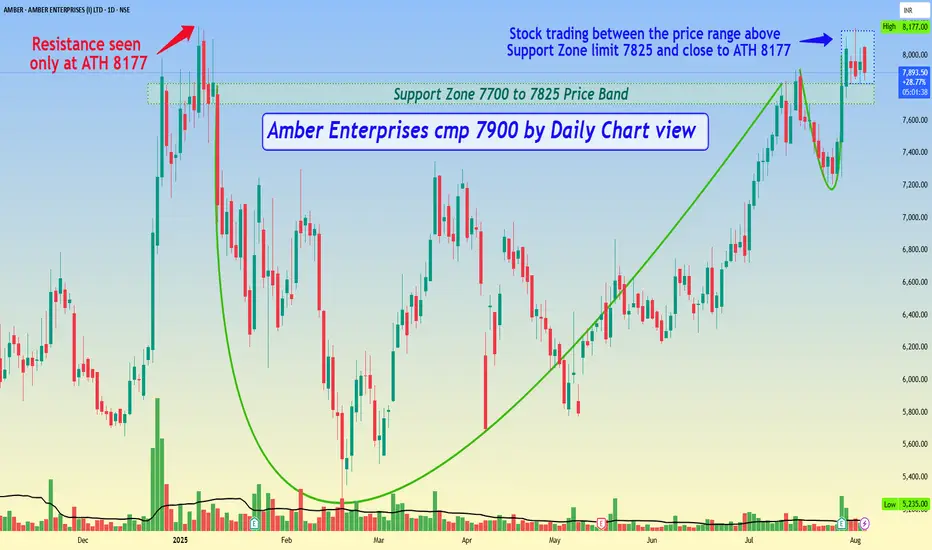
Amber Enterprises cmp 7900 by Daily Chart viewAmber Enterprises cmp 7900 by Daily Chart view
- Support Zone 7700 to 7825 Price Band
- Resistance seen only at the ATH 8177 level
- Volumes syncing closely and at times well above average traded quantity over past few days
- Stock is trading between the price range from above Support Zone limit 78
AMBER# Watchlist
#AMBER (D) is looking good above 7450 for tgt 7800/8500 soon.
Weakness below 7150.
# Disclaimer: View shared it for educational purposes only.

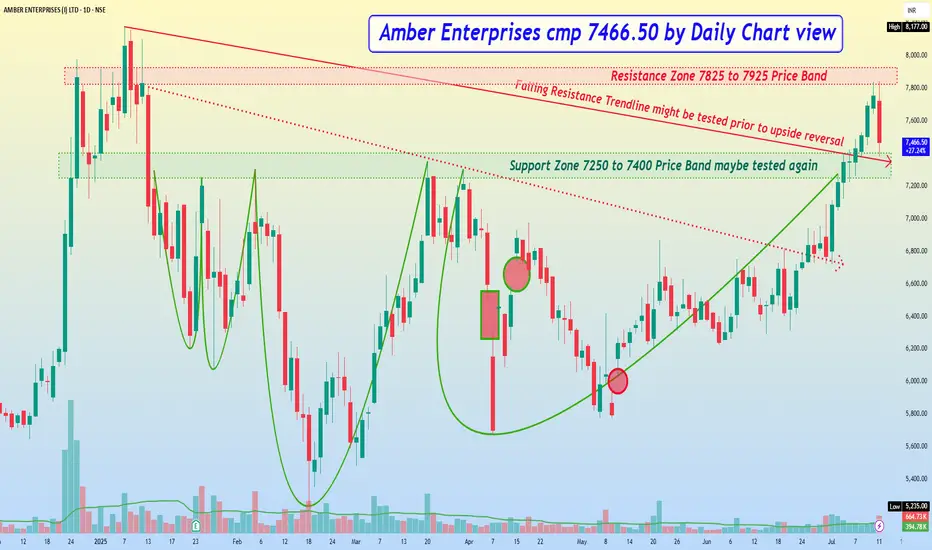
Amber Enterprises cmp 7466.50 by Daily Chart viewAmber Enterprises cmp 7466.50 by Daily Chart view
- Resistance Zone 7825 to 7925 Price Band
- Support Zone 7250 to 7400 Price Band maybe tested again
- Falling Resistance Trendline might be tested prior to upside reversal
- Volumes are synced with avg traded quantity but faced selling pressure on
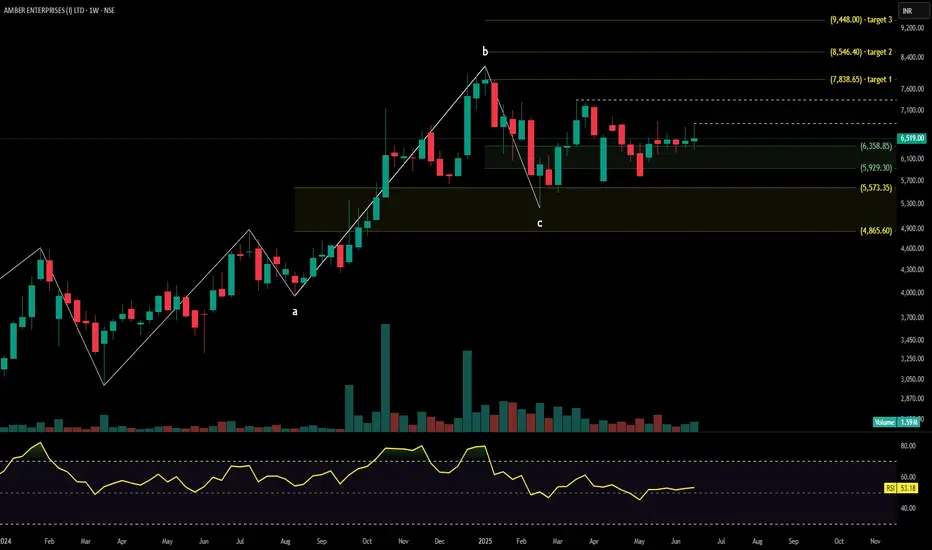
Amber Enterprises🚀 Swing Setup: Amber Enterprises (NSE)
📍 Buy zone: ₹ 6,620 – 6,700
🛡️ Stop: ₹ 6,420 (≈ ₹ 200 risk)
🎯 Target-1: ₹ 7,100 — book part or trail
⚡ Breakout trigger: daily close > ₹ 6,750 on strong volume → ride toward ₹ 7,500-7,600
Why it’s on the radar
• Price recently reclaimed the 20- & 50-DMA, indi

AMBER ENTERPRISES technical analysisAmber Enterprises (NSE: AMBER) is currently trading at INR 6,519, with signs of a consolidation breakout forming. The company is a major supplier of HVAC components and room air conditioner solutions, catering to both B2B and OEM clients, with rising interest in electric mobility and smart appliance
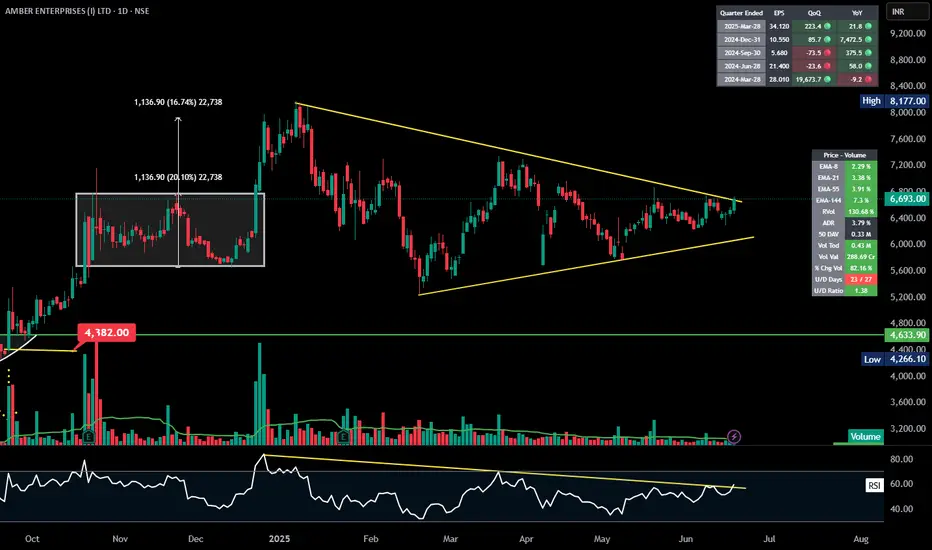
AMBER | Watchlist | Symmetrical triangle | DailyHere’s the analysis of your chart for **Amber Enterprises Ltd (NSE)**:
---
### 📊 **Price Action & Patterns**:
* The stock is forming a **symmetrical triangle** pattern, which is visible by the yellow trendlines.
* Recently, the price has **broken out** above the top trendline around ₹6,693.
* Pri
See all ideas
Summarizing what the indicators are suggesting.
Neutral
SellBuy
Strong sellStrong buy
Strong sellSellNeutralBuyStrong buy
Neutral
SellBuy
Strong sellStrong buy
Strong sellSellNeutralBuyStrong buy
Neutral
SellBuy
Strong sellStrong buy
Strong sellSellNeutralBuyStrong buy
An aggregate view of professional's ratings.
Neutral
SellBuy
Strong sellStrong buy
Strong sellSellNeutralBuyStrong buy
Neutral
SellBuy
Strong sellStrong buy
Strong sellSellNeutralBuyStrong buy
Neutral
SellBuy
Strong sellStrong buy
Strong sellSellNeutralBuyStrong buy
Displays a symbol's price movements over previous years to identify recurring trends.
SMALLCAP
Mirae Asset Nifty Smallcap 250 Momentum Quality 100 ETF Units Exchange Traded FundWeight
1.88%
Market value
1.44 M
USD
Explore more ETFs
Frequently Asked Questions
The current price of AMBER is 8,278.00 INR — it has increased by 2.93% in the past 24 hours. Watch Amber Enterprises India Ltd. stock price performance more closely on the chart.
Depending on the exchange, the stock ticker may vary. For instance, on BSE exchange Amber Enterprises India Ltd. stocks are traded under the ticker AMBER.
AMBER stock has risen by 2.71% compared to the previous week, the month change is a 8.55% rise, over the last year Amber Enterprises India Ltd. has showed a 67.06% increase.
We've gathered analysts' opinions on Amber Enterprises India Ltd. future price: according to them, AMBER price has a max estimate of 10,129.00 INR and a min estimate of 4,725.00 INR. Watch AMBER chart and read a more detailed Amber Enterprises India Ltd. stock forecast: see what analysts think of Amber Enterprises India Ltd. and suggest that you do with its stocks.
AMBER reached its all-time high on Sep 25, 2025 with the price of 8,498.00 INR, and its all-time low was 621.05 INR and was reached on Feb 18, 2019. View more price dynamics on AMBER chart.
See other stocks reaching their highest and lowest prices.
See other stocks reaching their highest and lowest prices.
AMBER stock is 2.53% volatile and has beta coefficient of 0.90. Track Amber Enterprises India Ltd. stock price on the chart and check out the list of the most volatile stocks — is Amber Enterprises India Ltd. there?
Today Amber Enterprises India Ltd. has the market capitalization of 287.27 B, it has increased by 0.95% over the last week.
Yes, you can track Amber Enterprises India Ltd. financials in yearly and quarterly reports right on TradingView.
Amber Enterprises India Ltd. is going to release the next earnings report on Nov 7, 2025. Keep track of upcoming events with our Earnings Calendar.
AMBER earnings for the last quarter are 30.80 INR per share, whereas the estimation was 22.75 INR resulting in a 35.40% surprise. The estimated earnings for the next quarter are 1.10 INR per share. See more details about Amber Enterprises India Ltd. earnings.
Amber Enterprises India Ltd. revenue for the last quarter amounts to 34.49 B INR, despite the estimated figure of 26.71 B INR. In the next quarter, revenue is expected to reach 19.43 B INR.
AMBER net income for the last quarter is 1.04 B INR, while the quarter before that showed 1.16 B INR of net income which accounts for −10.51% change. Track more Amber Enterprises India Ltd. financial stats to get the full picture.
Amber Enterprises India Ltd. dividend yield was 0.00% in 2024, and payout ratio reached 0.00%. The year before the numbers were 0.00% and 0.00% correspondingly. See high-dividend stocks and find more opportunities for your portfolio.
As of Oct 8, 2025, the company has 18.46 K employees. See our rating of the largest employees — is Amber Enterprises India Ltd. on this list?
EBITDA measures a company's operating performance, its growth signifies an improvement in the efficiency of a company. Amber Enterprises India Ltd. EBITDA is 8.24 B INR, and current EBITDA margin is 7.38%. See more stats in Amber Enterprises India Ltd. financial statements.
Like other stocks, AMBER shares are traded on stock exchanges, e.g. Nasdaq, Nyse, Euronext, and the easiest way to buy them is through an online stock broker. To do this, you need to open an account and follow a broker's procedures, then start trading. You can trade Amber Enterprises India Ltd. stock right from TradingView charts — choose your broker and connect to your account.
Investing in stocks requires a comprehensive research: you should carefully study all the available data, e.g. company's financials, related news, and its technical analysis. So Amber Enterprises India Ltd. technincal analysis shows the buy rating today, and its 1 week rating is buy. Since market conditions are prone to changes, it's worth looking a bit further into the future — according to the 1 month rating Amber Enterprises India Ltd. stock shows the buy signal. See more of Amber Enterprises India Ltd. technicals for a more comprehensive analysis.
If you're still not sure, try looking for inspiration in our curated watchlists.
If you're still not sure, try looking for inspiration in our curated watchlists.