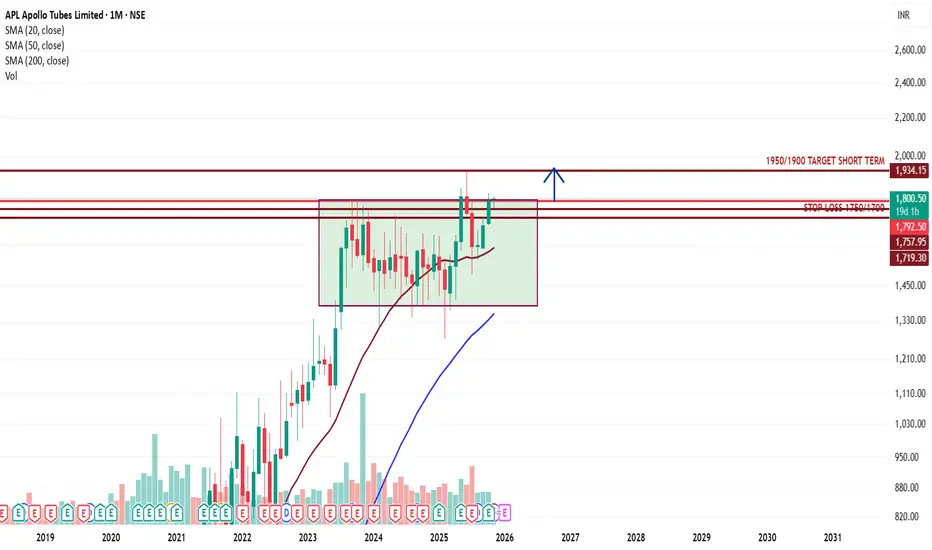
APL APOLLOW TUBE TARGET 1950 STOPLOSS 1750Apl Apollo tubes strong monthly consolidation from 2023 and high possibility to breakout of 1800 resistance and consecutive monthly closing from the previous month and weekly also. If the weekly close above 1800 then it will go up upto 2400. short term target is 1950
Trade ideas
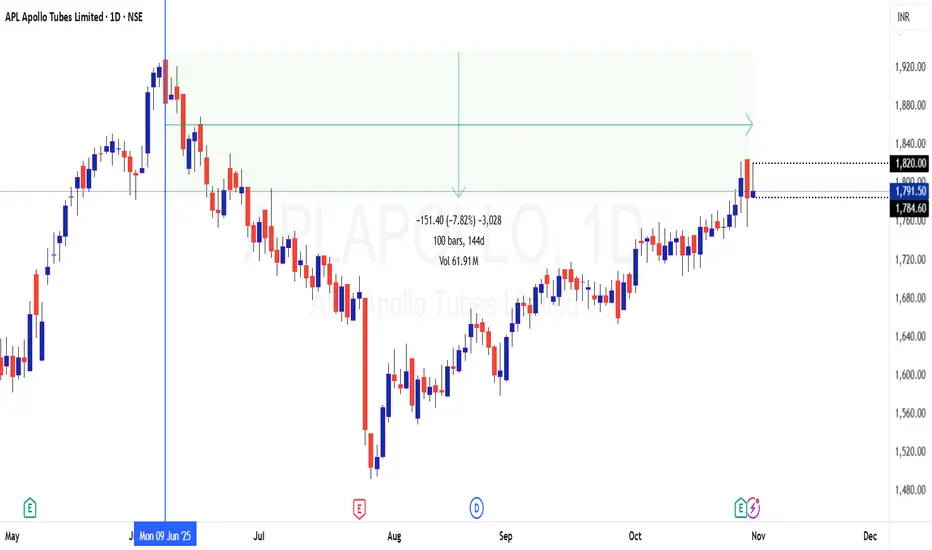
APLAPOLLO - Directional Move ahead?CMP: 1791.5
TF: Daily
I have been trying to follow/understand GANN principles and one of the key factor is the number 144.
From the Swing high made on 9th June 2025, the price has completed 100 Bars / 144 days on Friday (31st Oct). Both are very significant in the GANN timecycle calculation..
We should be expecting directional move from here on.. break and close outside of the day's candle will give us a guidance.
Interestingly, we could see, inside bar and outside bar formation in the previous days' candles..Lets track how this one moves in the coming days.
Disclaimer: I am not a SEBI registered Analyst and this is not a trading advise. Views are personal and for educational purpose only. Please consult your Financial Advisor for any investment decisions. Please consider my views only to get a different perspective (FOR or AGAINST your views). Please don't trade FNO based on my views. If you like my analysis and learnt something from it, please give a BOOST. Feel free to express your thoughts and questions in the comments section.
APL Apollo Tubes: Rising Wedge — The Climb Before the Slip?Price action has been rising within a narrowing wedge pattern — a structure that often signals exhaustion near the top. A breakdown below the lower trendline would confirm weakening momentum.
Disclaimer: This analysis is for educational purposes only and does not constitute investment advice. Please do your own research (DYOR) before making any trading decisions.
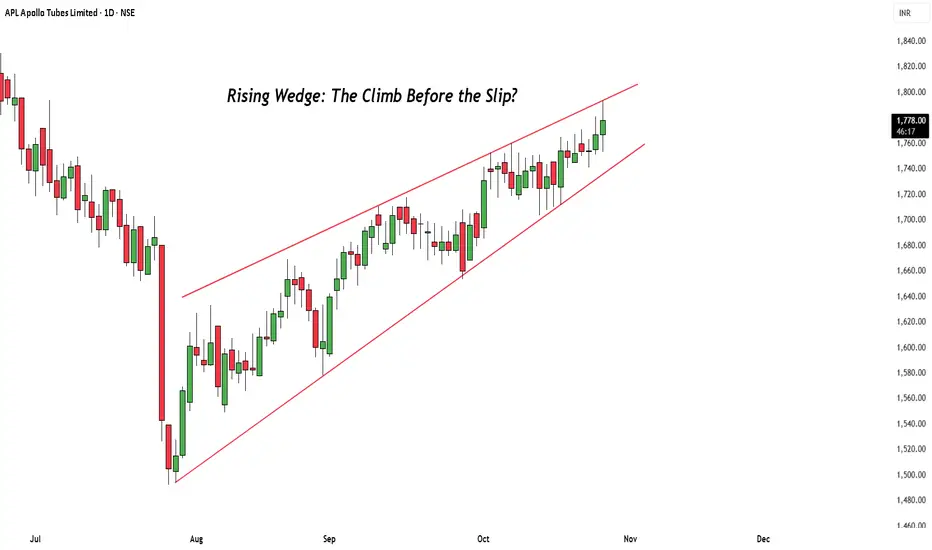
Pattern Matters I Trust this kind of patterns , Yes Trading FNO has higher risk of losing Money due to Market volatility
One can View & Study the pattern trading along the side Divergence in MACD
This is education content
Good luck
APLAPOLLO - INVERTED H&S CHART BREAKOUT PATTERN [ BUY SIDE]More technical indicator data is available in the YouTube video.
If you like the idea, please follow me and don’t forget to like, share, and subscribe to my YouTube channel.
APLAPOLLO 1 Day Time Frame📊 Intraday Support & Resistance Levels
Immediate Support Levels: ₹1,717.57 and ₹1,733.63
Immediate Resistance Levels: ₹1,764.6 and ₹1,764.6
📈 Pivot Points
Standard Pivot Point: ₹1,749.57
Camarilla R3: ₹1,742.82
Fibonacci Resistance: ₹1,748.19
📉 Technical Indicators
Overall Technical Strength: Strong Buy
Moving Averages: Bullish
Oscillators: Bullish
🔮 Trend Outlook
The stock is trading above key support levels, indicating a potential continuation of the upward trend. However, it's essential to monitor for any signs of reversal or consolidation near resistance levels.
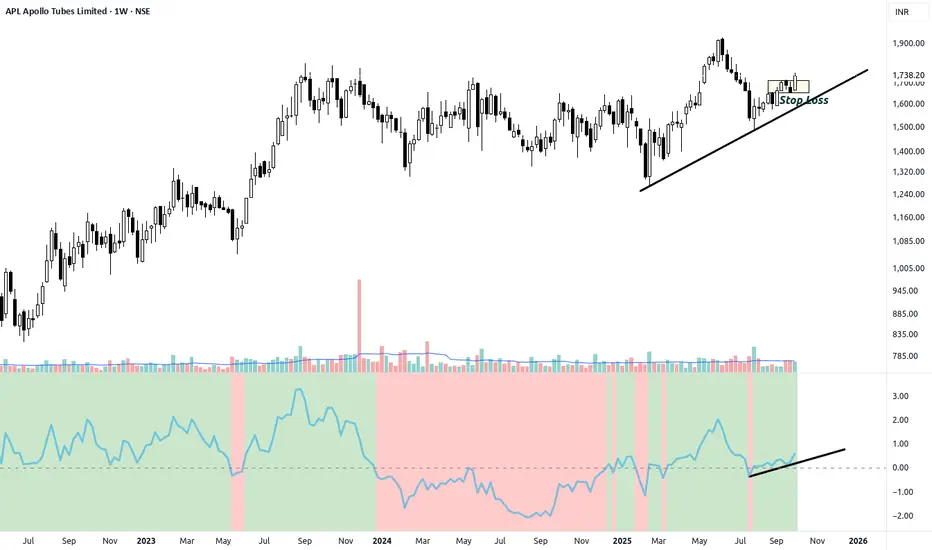
APLAPOLLO🔑 Technical Highlights
✅ Trend Strength: The stock is trading above all key moving averages (20, 50, 200 DMA). Currently ~5% above its 200 DMA, indicating strong long-term positioning.
✅ Relative Strength: RS vs Nifty remains positive and trending upwards, suggesting institutional interest and sector leadership.
✅ Breakout: The stock has broken out of a small consolidation range on the weekly chart, backed by a rising trendline.
✅ Base Formation: Currently forming a stage 1 base on the weekly timeframe and trading ~12% away from its major pivot point.
✅ Risk-Reward Setup: Attractive R:R with a stop loss just below the last weekly candle.
✅ Volume & Institutions: Recent institutional holding increase in the last quarter adds conviction.
📊 Moving Average Context
50 DMA: Acting as an immediate support zone.
200 DMA: Stock is comfortably placed above, suggesting a strong long-term trend.
Expectation: Price to consolidate or pull back towards the 50 DMA before resuming upside.
📌 Levels to Watch
Support: ₹1,650 – 1,680 (trendline + 50DMA)
Stop Loss: Below ₹1,650 (last weekly candle low)
Resistance / Pivot Zone: Around ₹1,940 – 1,960 (12% above current levels).
Upside Potential: ₹2,050+ if pivot breakout sustains with volumes.
⚖️ Risk-to-Reward
Current setup offers 2.5R to 3R potential, making it an attractive swing trade candidate.
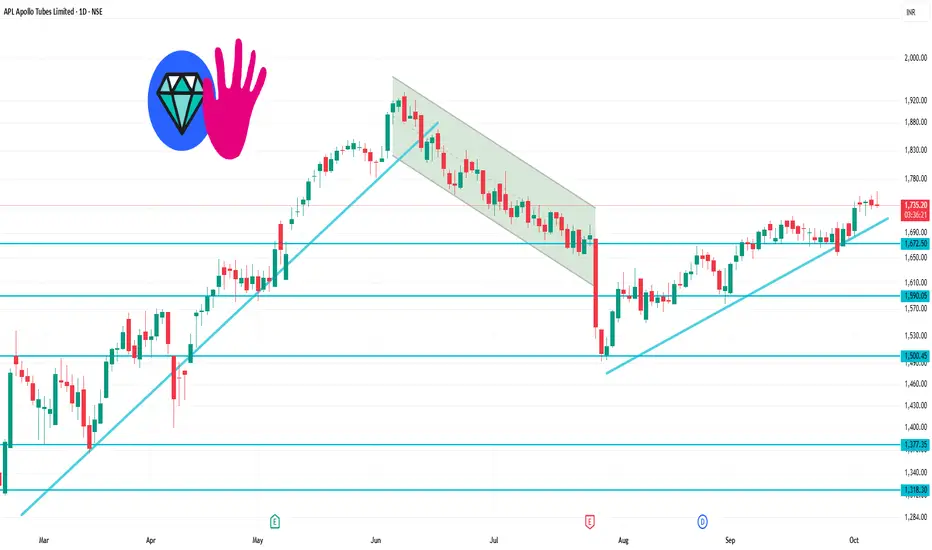
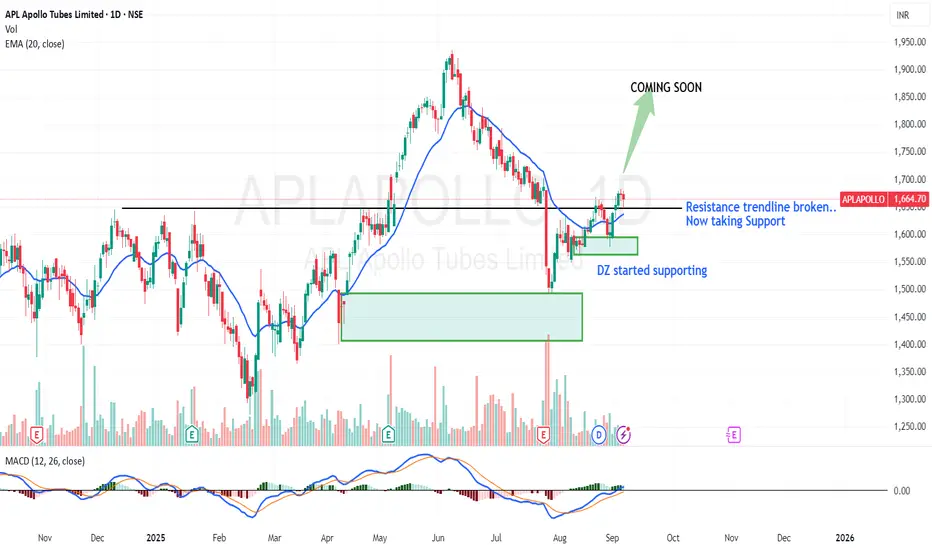
#APLAPOLLO will it be next APOLLOMICRO ??Nearby supply zones are tested and the demand zones started supporting the price as the plaayers are accumulating.. and helping the price to go up...
Resistance trendline is now broken and started supporting
Sellers are now sideways and Buyers are hero now... Just wait the director for ACTION .. will see you guys on SUCCESS PARTY
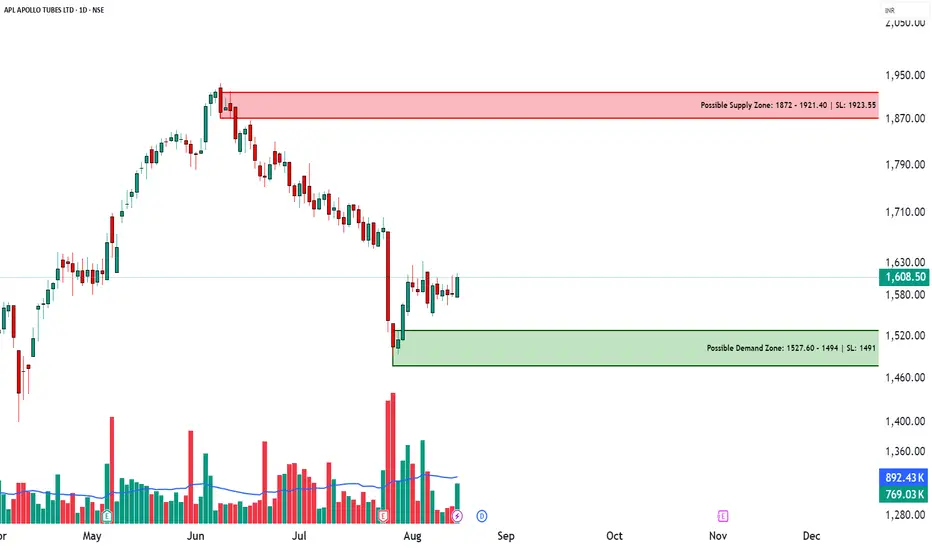
APLAPOLLO – Technical & Educational Snapshot📊 APLAPOLLO – Technical & Educational Snapshot
Timeframe: Daily / Weekly / Monthly
Overall Bias (for learning): ⭐⭐⭐⭐ Moderately Bullish – supply & demand zones identified, breakout study in progress
🔹 Candlestick Observations
Daily Bullish Piercing → Bullish Engulfing Buyers showing short-term strength
Weekly Three Black Crows → Bullish Engulfing Bearish pressure absorbed; case study of reversal attempt
Monthly NA No clear signal on higher timeframe
🔹 Supply & Demand Zones (Learning Reference)
Supply Zone (Resistance area): ₹1872 – ₹1921.40
(Stop Loss Ref: 1923.95 → possible invalidation if breached)
Demand Zone (Support area): ₹1494 – ₹1527.60
(Stop Loss Ref: 1491 → possible invalidation if broken)
🔹 Technical Observations
✅ Strong bullish candles forming
✅ Bullish Engulfing → buyer dominance visible
✅ Open = Low → intraday bullish bias illustration
✅ Double Wick → rejection from lower levels
✅ Breakout probability higher if weekly channel is cleared
📊 Volume Study
Any breakout is more reliable when supported by higher-than-average volume.
Traders typically wait for volume confirmation alongside bullish candlestick follow-through before validating a breakout.
📌 Summary (Learning View Only)
APLAPOLLO is a useful case study in demand-supply dynamics and bullish engulfing setups.
Lesson: Breakouts above consolidation + volume confirmation often strengthen trend continuation.
⚠️ Disclaimer (SEBI-Compliant)
This post is for educational & informational purposes only. It is not a buy/sell recommendation, not research, and not investment advice.
I am not a SEBI-registered advisor. Examples are for learning through chart patterns and public market data. Please consult a SEBI-registered financial advisor before making investment decisions.
💬 Found this useful?
🔼 Tap Boost so more traders can learn from structured analysis.
✍️ Share your views in the comments — let’s grow together.
✅ Follow @simpletradewithpatience for clean, zone-based setups & beginner-friendly market education.
🚀 Stay Calm. Stay Clean. Trade With Patience.
Trade Smart | Learn Zones | Be Self-Reliant 📊
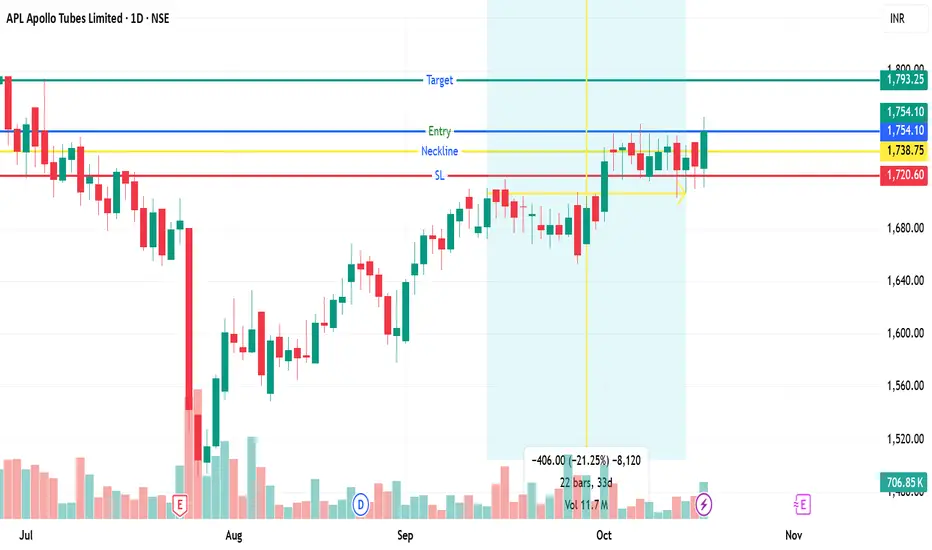
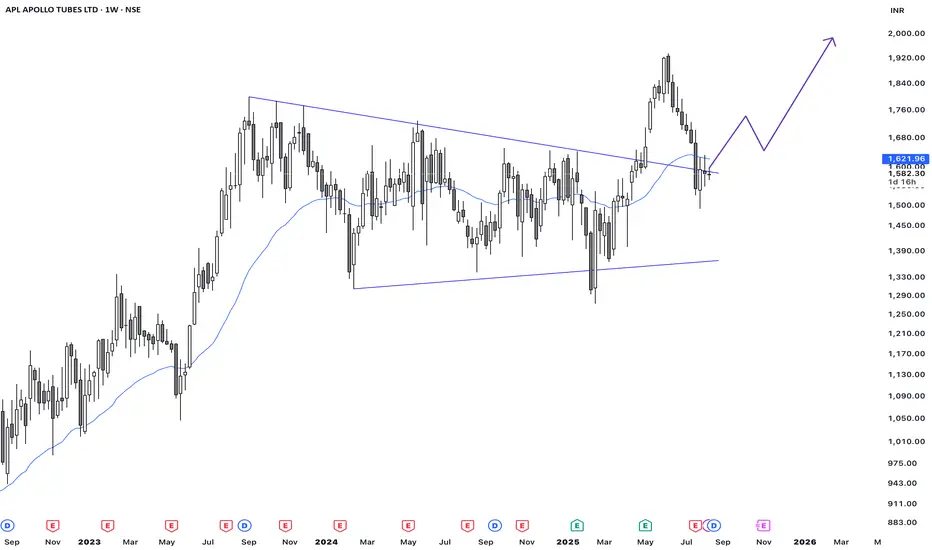
APL Apollo Tubes Ltd – Weekly Chart UpdateAPL Apollo Tubes Ltd – Weekly Chart Update: Breakout from Multi-Period Consolidation
Technical Structure:
The chart clearly shows a long consolidation between early 2023 and mid‑2025, bounded by converging trend lines forming a symmetrical wedge/triangle.
Recently, price decisively broke above the upper trendline, accompanied by a volume spike, signaling a classic bullish breakout scenario. A subsequent retest of the breakout zone (~₹1,580–1,600) appears to be underway—buyers holding this zone could pave the way for a continued rally .
Potential Targets and Setup:
• Entry Zone: Weekly close above 34 week moving average
• SL on entry: 1485
• First target: 1900
• If momentum sustains, keep trailing SL
• Invalidation: SL is hit or any opposing bearish signal on chart
Fundamentals:
• The technical breakout aligns with healthy fundamentals—strong ROCE/ROE and sustained revenue growth.
• Though valuations are rich (P/E ~55x, P/B ~10x), the quality of earnings and performance metrics justify the multiple.
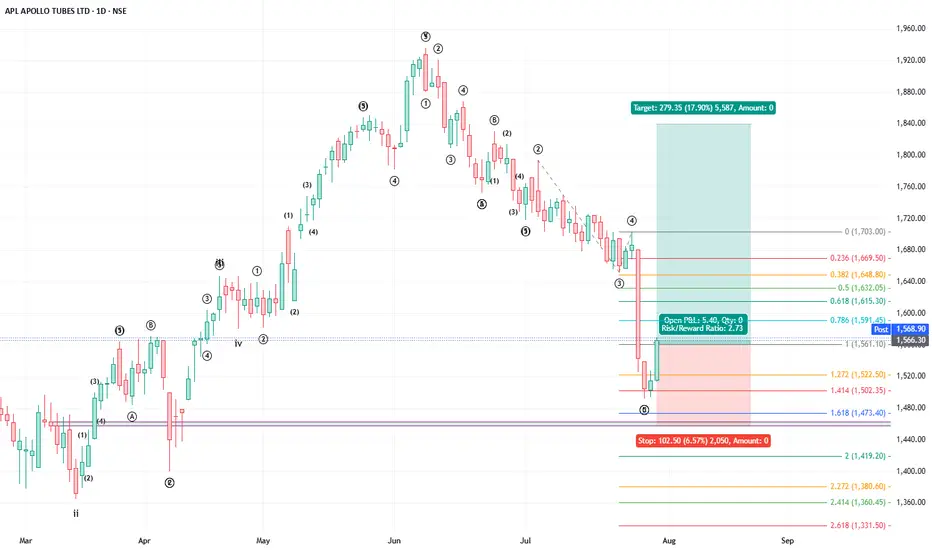
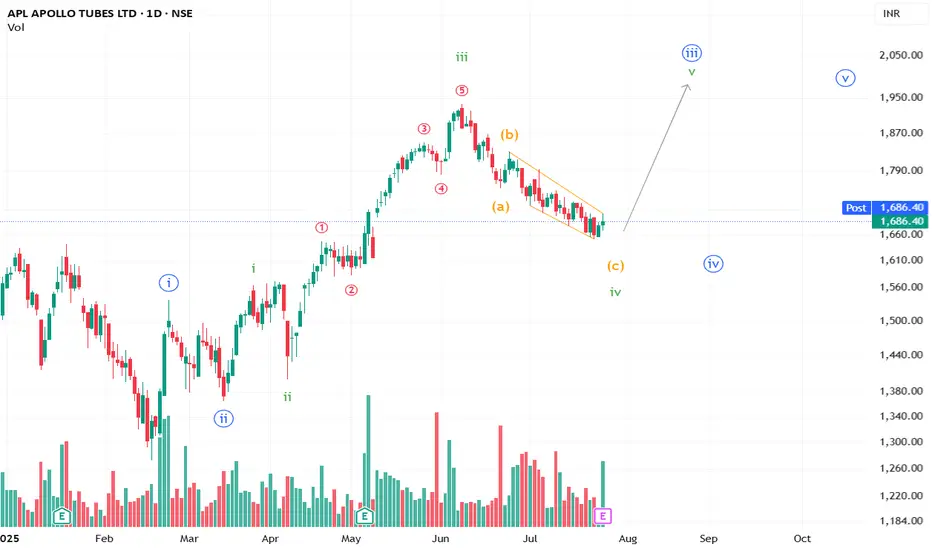
Buy Apollo TubesAPL Apollo Tubes has completed one full motive wave and related corrective wave in the form of a zigzag. All the wave markings are given in the chart.
One may consider going long on the stock with an initial target of 0.786 fibo retracement of the corrective wave. Stop loss is considered below 1.618 fibo retracement of Wave 2-3 to 4 of wave C of the corrective structure providing a risk-reward ratio of over 2.5x.
Will update the further targets as the stock waves unfold.
Happy Trading !!
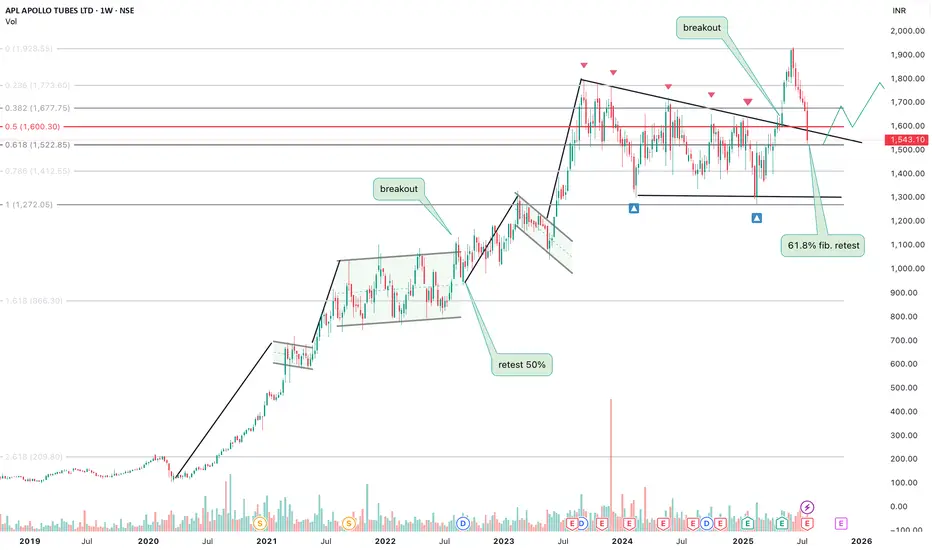
apollo tubes longThe chart has repeated its pattern of consolidation followed by breakout and retest .
we can expect a good upside momentum as it has completed its 0.618% retracement based on earlier chart formations.
the financials and companies growth looks great with increasing revenues and profits.
let me know what you investors feel in the comment.
APL Apollo Tubes Limited Set to Surge?A well-formed ABC correction to the downside appears to be losing steam, and an upward move may take shape.
**This is an educational market outlook, not investment advice. Please consult a SEBI-registered advisor before taking any investment decisions.**
Buy As per Direction⦁ Only Trendlines Used — No Other Confluence
⦁ Stoploss Is Based on the Trendline
⦁ Retest of Trendline Builds Confidence
⦁ Trendline Angle Shows Momentum
⦁ Trendlines Define Risk Clearly

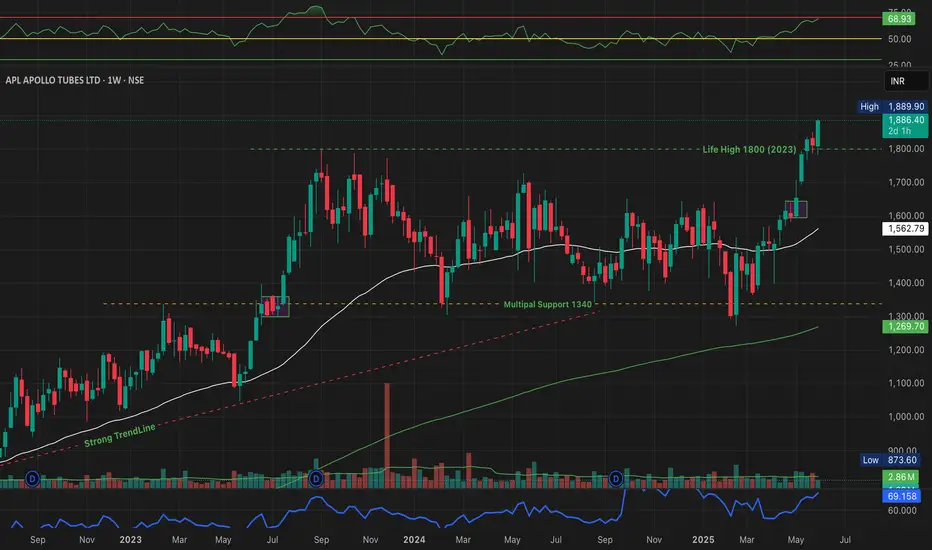
APL Apollo Breaks ALL - Time High - Fresh Momentum Emerging?Stock has convincingly broken its 2023 LIFE HIGH OF 1800, with strong volume and momentum.
- RSI near 69 - bullish strength , not yet OVERBOUGHT
- Price holding above 50 EMA
- Multiple Support Zone at 1340 respected multiple times
🚨 WILL THIS BREAKOUT SUSTAIN? OR WILL SEE A RETEST OF THE 1800 ZONE?
Analysis By Mayur Jayant Takalikar -- FOR LEARNING & OBSERVATIONAL USE ONLY.
APL APOLLO TUBES: Looking bullish!1. Strong bounce from the demand zone.
2. Breakout above the trendline will confirm the bullishness further.
3. Trade can be planned accordingly.
4. Volumes are also indicating strength of the buyers.
⚠️ Disclaimer: This is NOT a buy/sell recommendation. This post is meant for learning purposes only. Views are personal. Please, do your due diligence before investing.⚠️
💬 What are your thoughts on this share it in the comments below. ✌️
🔥 Happy Trading!✅🚀

Channel breakout for buy in APLAPOLLOThis is a channel breakout strategy for APLAPOLLO TUBES. RSI has been giving bullish signals, which means a breakout and retest of 1624 will activate a buying entry for the targets mentioned above. The ultimate target as per the pattern is 2024 in the longer term.
Targets in between are the recent lower highs like 1728, 1800+
Stop is when the price after breakout enters the channel again.

APL Apollo Tubes - Flag & Pole BONSE:APLAPOLLO gave a Flag & Pole Breakout today. Post Q4 Results.
Con-Call Highlights:
MARCH-QUARTER CONSOL TOTAL REVENUE FROM OPERATIONS 55.09 BILLION RUPEES
MARCH-QUARTER CONSOL PROFIT 2.93 BILLION RUPEES
SEES TOTAL CAPACITY OF 6.8 MILLION TONS BY FY28
SEES CAPEX OF 15 BILLION RUPEES IN NEXT 3 YEARS
Keep in the Watchlist.
NO RECO. For Buy/Sell.
Disclaimer: "I am not a SEBI REGISTERED RESEARCH ANALYST AND INVESTMENT ADVISER."
This analysis is intended solely for informational and educational purposes and should not be interpreted as financial advice. It is advisable to consult a qualified financial advisor or conduct thorough research before making investment decisions.

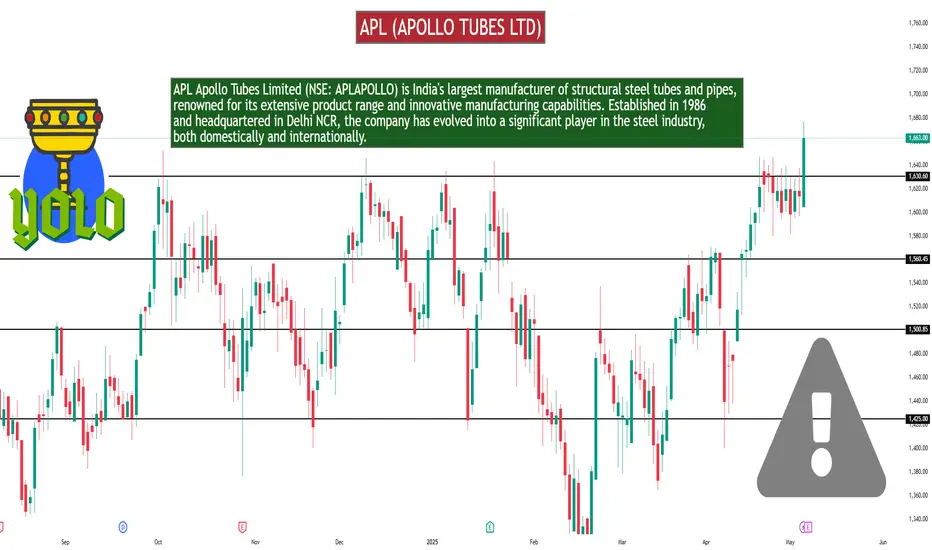
APL (APOLLO TUBES LTD)As of May 6, 2025, here are the key intraday support and resistance levels for APL Apollo Tubes Ltd (NSE: APLAPOLLO):
📊 Intraday Support & Resistance Levels
Standard Pivot Points:
Support Levels:
S1: ₹1614.17
S2: ₹1599.23
S3: ₹1580.17
Resistance Levels:
R1: ₹1648.17
R2: ₹1667.23
R3: ₹1682.17
Fibonacci Pivot Points:
Support Levels:
S1: ₹1614.17
S2: ₹1601.18
S3: ₹1593.15
Resistance Levels:
R1: ₹1635.18
R2: ₹1648.17
R3: ₹1656.20
Camarilla Pivot Points:
Support Levels:
S1: ₹1615.18
S2: ₹1612.07
S3: ₹1608.95
Resistance Levels:
R1: ₹1621.42
R2: ₹1624.53
R3: ₹1627.65
The current price of APL Apollo Tubes Ltd is trading above the Camarilla R3 and Fibonacci R1 levels, indicating strong bullish momentum. Traders may consider these levels for potential entry or exit points, keeping in mind that surpassing the R3 levels could suggest overbought conditions, while approaching S1 or S2 levels might indicate potential support zones.
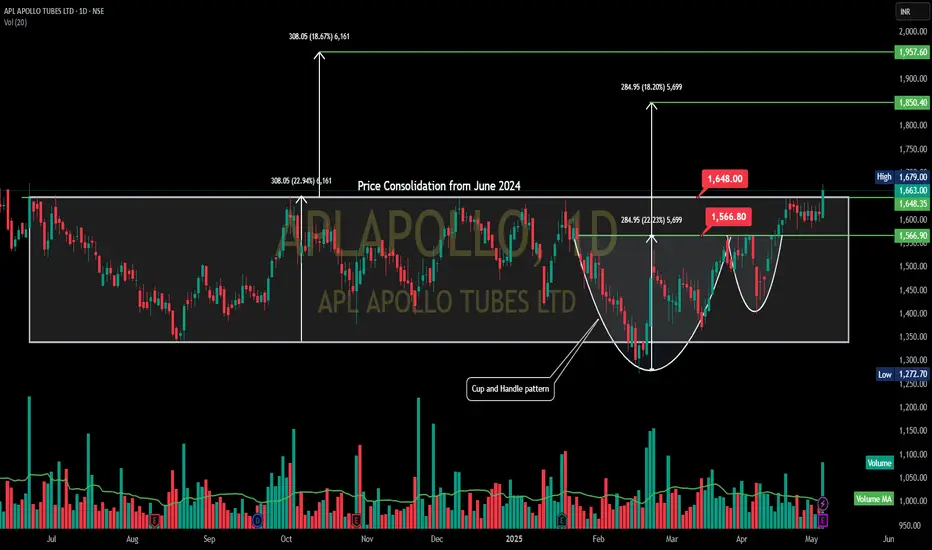
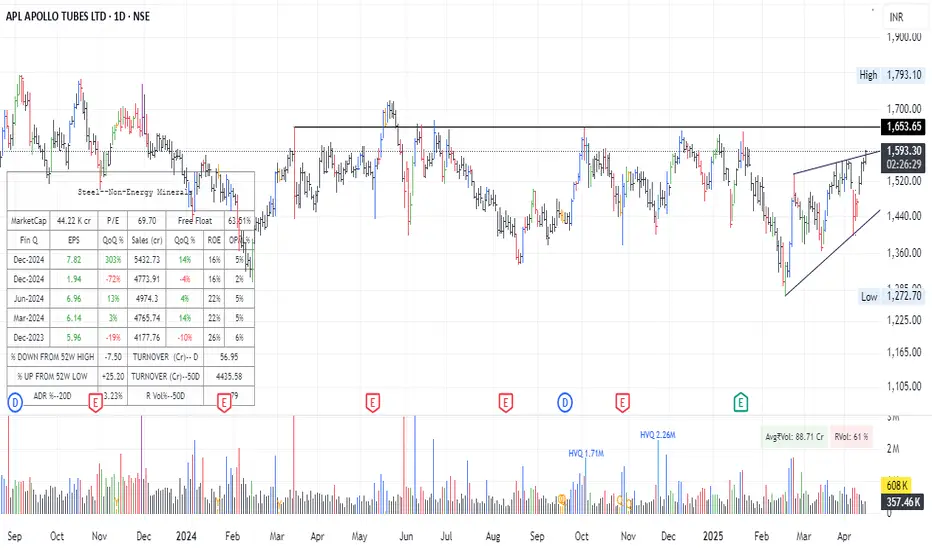
APL APOLLO TUBES LTD - Consilidation- Cup and HandleAPL APOLLO TUBES LTD - Daily Chart
Pattern: The chart shows a period of Price Consolidation from June 2024 within a broad range, roughly between 1,300 and 1,640. Within this larger consolidation, a "Cup and Handle" pattern has formed more recently.
Cup: Formed from approximately mid-February 2025 to mid-April 2025, with the low around 1,272.70.
Handle: A smaller consolidation (handle) formed in late April/early May 2025.
Neckline/Breakout Level: The price is attempting to break out above the neckline of this Cup and Handle, which also coincides with the upper resistance of the broader consolidation range, around 1,640.00 - 1,648.00.
Volume: Volume appears to be increasing on the current breakout attempt from the handle and the larger consolidation.
Target:
The depth of the more recent cup (approximately 284.95 points) projected from the breakout (around 1,586 - which seems to be the C&H neckline) gives a target around 1,850.40.
The height of the larger consolidation (from Oct 2024, approx 308.05 points) projected from the upper boundary breakout (around 1,648) gives a target around 1,957.60. The chart uses both.
Support: The breakout level around 1,640.00 - 1,648.00 is the key immediate support. The low of the cup (1,272.70) is a more significant long-term support.
Resistance: The immediate resistance is the current breakout zone. The projected targets of 1,850.40 and 1,957.60 are the next resistance levels.
Interpretation: APL Apollo is attempting a significant breakout from both a recent Cup and Handle pattern and a longer-term consolidation range. If successful, this could lead to a strong upward move towards the projected targets. The increased volume supports the bullish case. Confirmation above 1,648.00 is key.
Apollo bullish on weekly tfOnce the chart will break the pattern it will most likely to go upside and give target of at least 15-20% with sl of 10%

Apl Apollo Tube - ReRating Candidate !!??Stock peaked in Sep 2023.. Has been Range bound since almost 2 yrs now.. Interestingly had the best quarter ever last qtr.. Margins are stable and constant through many months.. If margins expand we are looking at a re-rating candidate.. Over all looking very interesting..
APL Apollo Tubes Ltd Stock Analysis**GlobalTradeHub Stock Analysis**
**APL Apollo Tubes Ltd (APLApollo)**
**Fundamental**: A leading player in the Indian steel pipe industry, APL Apollo has consistent growth driven by infrastructure demand.
**Technical**: Bullish trend with moving averages supporting upside. RSI is neutral, indicating room for further growth.
**Support Levels**: ₹1,000, ₹950
**Resistance Levels**: ₹1,150, ₹1,200
Let me know if you'd like to analyze another stock!
