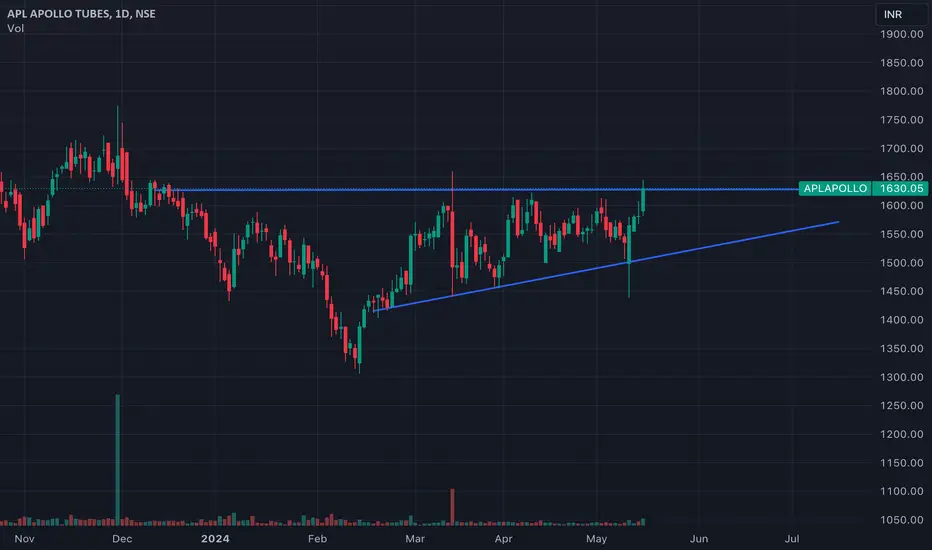
APLAPOLLO - POCs EMAs and TrianglesChat markings are self explanatory.. but here is the brief summary anyways.
On hourly TF, the price has successfully trading above the 200 period EMA. In the previous instances, when it traded above 200 HEMA, it moved about 10%.
Based on the past pattern/price action, a retest of 200HEMA cant be ruled out (around 1550 levels)
Also, POCs of the previous sessions are now acting as a strong resistance (1595-1600)
1600 CE has significant writers, unless the price moves and trades above, price movement will be subdued until then. The good news is that 10% of them have covered already, if the price moves swiftly, the rest of them also will cover and thereby propel the move on the upside
if the price closes below 1540 on hourly, the GAP filling at the lows at 1400 levels cant be ruled out either.
On Daily TF, price is trading within the Triangle and can attract supply at the higher levels.
I am not a SEBI registered Analyst. Views are personal and for educational purpose only. Please consult your Financial Advisor for any investment decisions. Please consider my views only to get a different perspective (FOR or AGAINST your views). Please don't trade FNO based on my views.
Trade ideas

My study on this scripSince long its been in sideways and now it has made two HL, now it has picked up the momentum

Cup & Handle Chart Pattern Breakout | APLAPOLLO⭕️ Price Action Analysis Alert !!!⭕️
FOR EDUCATION PURPOSE ONLY!!!
✅Overview of APL Apollo Tubes Ltd.
👉It is India’s leading manufacturer of structural steel tubes and hollow sections, widely used in construction, infrastructure, and industrial applications
👉Focused on substituting traditional building materials with advanced steel solutions.
✅Fundamental Analysis
📍The company maintains healthy profit margins due to cost-efficient operations and strong pricing power.
📍 Managed to keep its debt under control, maintaining a strong balance sheet.
📍High ROE and ROCE
📍Stock valuation due to strong growth potential, market leadership, and consistent performance.
✅Technical Analysis:
1️⃣Cup&Handle chart Pattern Bo
2️⃣Supporting Volume
3️⃣Supporting EMA
4️⃣BO Confirmation
5️⃣Strong Support
✅Check out my TradingView profile to see how we analyze charts and execute trades.
🙋♀️🙋♂️If you have any questions about this stock, feel free to reach out to me.
📍📌Thank you for exploring our idea! We hope you found it valuable.
🙏FLLOW for more !
👍LIKE if useful !
✍️COMMENT Below your view !


APLAPOLLO - Weekly AnalysisIn the Weekly Chart of APLAPOLLO,
we can see that; it is at decision making point.
Possible momentums are shown in chart.

My view on Apollo TubesApollo Tubes seems Strong buying candle on weekly chart at support line.
It should touch upper trendline in coming weeks.
Keep eye on it.

APLAPOLLO: Hammer at weekly at Lower Bollinger BandIt has formed a perfect hammer on weekly chart just at its previous resistance breakout level. Volumes are rising indicating support below 1339. A hammer on weekly chart is sign on trend reversal which is exactly coinciding with earlier resistance level. So, it can reverse from this in coming week.

APL Apollo Tubes : Falling WedgeAPL Apollo :
Falling Wedge breakout possibility
Looks great above 1455

APL APOLLO in Making Wave ((4))
Reason :Month chart structure is clear bullish sequence making Higher High and Higher lows.
Trend is Upwards, So trade will be buying
Now opportunity for buying in Uptrend means, when we get corrective wave formation scenario like wave 2 or Wave no 4 in any degree. so that we can En-cash the upcoming Impulsive major moves in the form of wave 3 and wave 5 in general.
In this chart as per my Elliot Wave count and analysis we are into making of Flat correction pattern Wave ((4)) in Black which is a corrective wave. The same can be completed at 1253 range when the wave (A) blue equal Wave (C) blue which is yet in making.
So the Fibonacci Extension level from mapped from (A)-(B) blue gives us the Range of 1253.5 - 1027.55 which is 100% and 161.8% of Fibonacci Extension.
Once price passes 1027.55 it will be like a impulsive wave on downside and their will be change in wave count and we may have a further deep correction in stock.
However till then we can go with the current view and plan a Buying at 1253.5 Level.
Trade Management :
We can expect min. Bounce in 3 wave up from the Blue box mentioned.
Once we are filled with buy order we will be booking partial profit of 50% Qty at 50% Fibonacci Extension of Wave (C) blue and subsequently will move our stop oss from Exiting 1027 Level to Entry level and Make our trade Risk Free.
and Keep trailing Stop loss for balance 50% Qty once our trade moves in our direction Stop loss will be placed at low of previous Swings.
Happy Trading
Regards
Vijay DHAGE
profitadda_iteind

APL Apollo Tubes: Decent fundamental outlook Fundamental thesis
-Guidance for higher capacity and production in '25 - '26
-Company fundamentals have constantly outperformed previous periods
-Good return ratios (Avg 6yr ROE > 30%/ROCE >29%)
-Stock trading at July 23 level with all fundamentals outperforming previous periods
-Increase in FII and DII holdings
- Considerably low risk play as it one of the biggest steel products manufacturers simply facing cyclical issues like with every commodity related business
Technical
Stock at 1yr support with previous bounce backs seen at this level
Daily RSI at 40
Valuation
Centrum priced the stock at 1670 INR (13% upside)
ISec priced at 1800 INR (22% upside)
My analysis gave a px tgt of 1806 INR (22% upside)
Avg upside of 17% - 18%
With a good margin of safety a leveraged play is possible, leading to potential 40 - 50 % returns on the stock
Target
I would keep my TP at 1630Rs (upside of 10%) and will enter with leverage

Commodities in focusAPL Apollo Tubes CMP 1581
I see strength in commodities sector as a whole. This stock is still a good buy at CMP of 1581. Tgts are on the screen.

APLAPOLLO bullish; above 1730 ? - Friday 24-May.
The above information does not constitute investment/trading recommendation and it is purely for educational purpose....
INTRADAY Trading Strategy in 3 stages of breakouts:
1) Impulse upmove stage: The strong upmove (nearly upto 1% from trigger-price) happens within five minutes. "High Risk Traders" buy on breakouts in hope of continuation of upmove. "High Risk Traders" may have to patiently wait through the Pullback-Consolidation stage to realize profits. High risk:High reward set up as breakouts may fakeout (reversal)also
2) Pullback-Consolidation stage: After the above "Impulse upmove stage"; the price may then pull back and move sideways (between "Open" price and "High" of the above "Impulse upmove stage"). "Safe traders" with minimum risk profile wait for a breakout from the consolidation stage to enter into trade , to book high profits in the final "Breakout continuation" stage
3) Breakout continuation: Stocks often in the third stage breaks up above the "High" of the first "Impulse upmove stage" and continue to go higher again.
Both Safe Traders/High Risk Traders book profits at this stage
SWING Trading Strategy:
Position is created, only upon stock closing above the entry price on day closing basis and is held on for 5-10 trading sessions for larger gains (5-10%)
The above information do not constitute, financial, investment, trading, or other types of advice or recommendation.It is purely for educational purpose....

[swing trade] APLAPOLLOGood opportunity to get some 4 to 6% in APLAPOLLO. It has given BO with good volumes..let's wait for some retracement. I dont recommend others to trade on my views.
APL APOLLO TUBES - Symmetrical TriangleAPL Apollo Tubes recently formed symmetrical triangle and expecting the breakout in upcoming days.
1. If price break and close above lower top (downtrend line) then buy order will be initiate
2. If price break and close below the rising support then sell order will be trigger
Thank You
Arvind Yadav, Cfa
Arvind Share Academy

APLAPOLLOAPLAPOLLO is on the verge of breakout. One can keep it in watchlist for Short term to Medium Term holding.
The Previous Swing Low can be Considered As SL.


APLAPOLLO Near BO, 21/50 EMA cross near as well [DAILY]APLAPOLLO is near BO, 21/50 EMA cross is also about to happen.
To add more things to it, for the past 4 weeks its relative performance is on an upwards slope when considering 750 stock universe.
Its RS score is still 32 so not much strong yet, so tread with caution.

APLAPOLLO REVERSINGAPLAPOLLO is reversing from long support line
two strong green candles at support line indicates bullish movement starting and go up for few sessions.
good for swing trade


APL APOLLO LTD WILL IT CONTINUE ITS TREND?APL APOLLO LTD WILL IT CONTINUE ITS TREND? What do you think

APLAPOLLO (Hidden Bullish Divergence)APLAPOLLO is in retracement zone and expected to give breakout in the coming sessions. Keep an eye on this stock for some decent returns.
NOTE: I'm not a SEBI REG. Study before investing.

APLAPOLLO - Weekly breakout - Great price actionA channel breakout on a weekly time frame with great price action in APLAPOLLO. There is an immediate upside of 15% (first target)... The company has good fundamentals and the risk-reward in this swing trade is very good!

APLAPOLLO : Long setup with huge upside Exciting Bullish Pattern Alert! 🐂
📊 Pattern: Broadening Pattern
📌 Symbol/Asset: APLAPOLLO
🔍 Description: Stock is in a pattern and now near to the support level.
View is bullish if support is intact.
👉 Disclosure: We are not SEBI registered analysts, this is not a buy or sell recommendation.
