ASIANPAINT 1 Day View📈 Current Price & Trading Range
Current Price: ₹2,357.70
Day’s Range: ₹2,337.00 – ₹2,366.60
Previous Close: ₹2,340.20
52-Week Range: ₹2,124.75 – ₹3,103.55
📊 Technical Indicators
RSI (14-day): 38.17 — indicating a neutral to bearish condition.
MACD: -41.59 — suggesting bearish momentum.
Stochastic RSI: 10.76 — points to an oversold condition, possibly signaling a reversal.
Rate of Change (ROC): -1.93 — reflects downward momentum.
Commodity Channel Index (CCI): -1.93 — supports the bearish outlook.
Average Directional Index (ADX): 32.54 — indicates a strong trend, confirming the downtrend.
Parabolic SAR: ₹2,320 — suggests a bearish trend continuation.
Supertrend: ₹2,444 — aligns with the bearish trend.
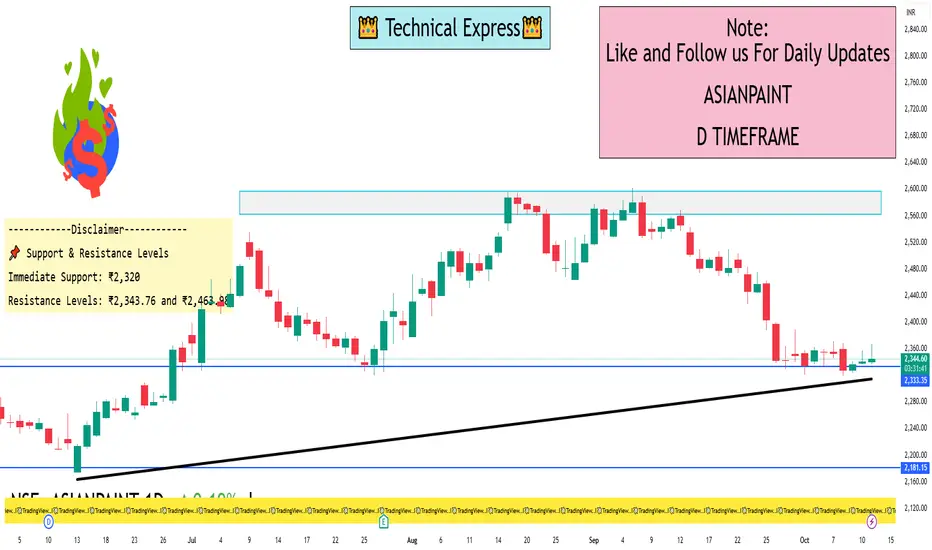
📌 Summary
Asian Paints Ltd. is currently in a bearish phase on the 1-day timeframe. Key support at ₹2,320 is crucial; a breach could lead to further declines. Conversely, a rebound above ₹2,463.98 might indicate a potential trend reversal.
Trade ideas
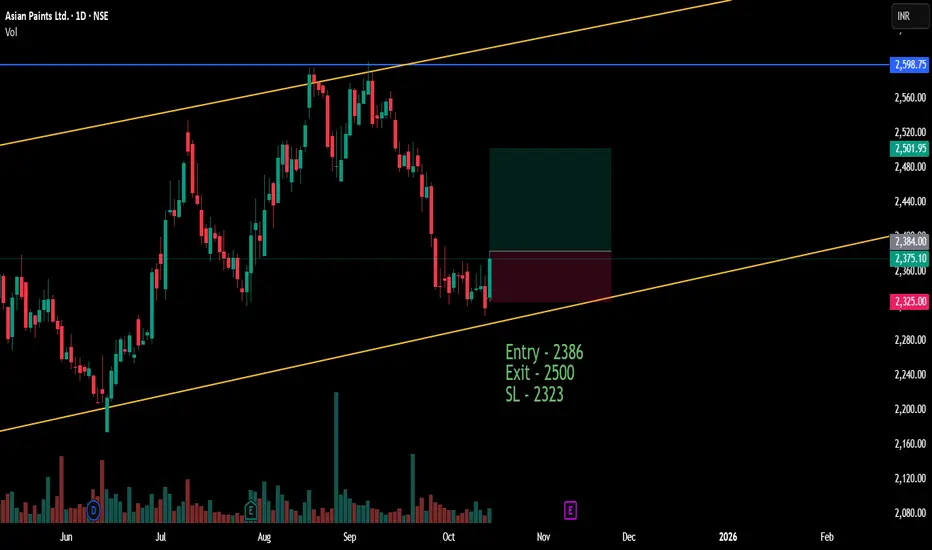
ASIANPAINT SWING BUY [DAILY]As mentioned in my previous shared idea about Asianpaint, I was waiting for a candlestick pattern for a buy confirmation. My trade would be -
ENTRY - 2386
EXIT - 2500
SL - 2323
After it hits 2500, one can trail their profit if it does not retrace below 2500.
Disclaimer - This is for learning purpose only. It should not be considered as a financial advice.
Asian Paints- Buy limit orders I don't want to write long story to describe the idea.
Simple institutional interest can push the price upside for sometime.
This is not a long term idea.
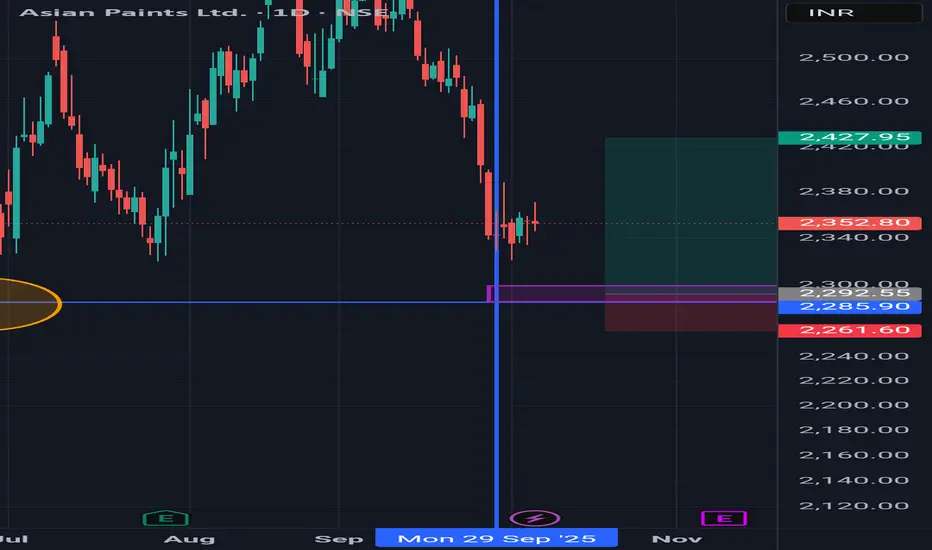
Swing Trade | ASIANPAINT | Price On Demand Zone.📌 Entry: Buying today as price reacts to a key demand zone
📅 Date: 10-Oct-2025
📈 Strategy: Demand Zone
⏳ Exit Plan: Will exit any day within the next 14 calendar days, based on price action or target logic
🔐 Risk Management: No stop-loss applied. This is part of my 30-stock portfolio with equal capital allocation across all positions.

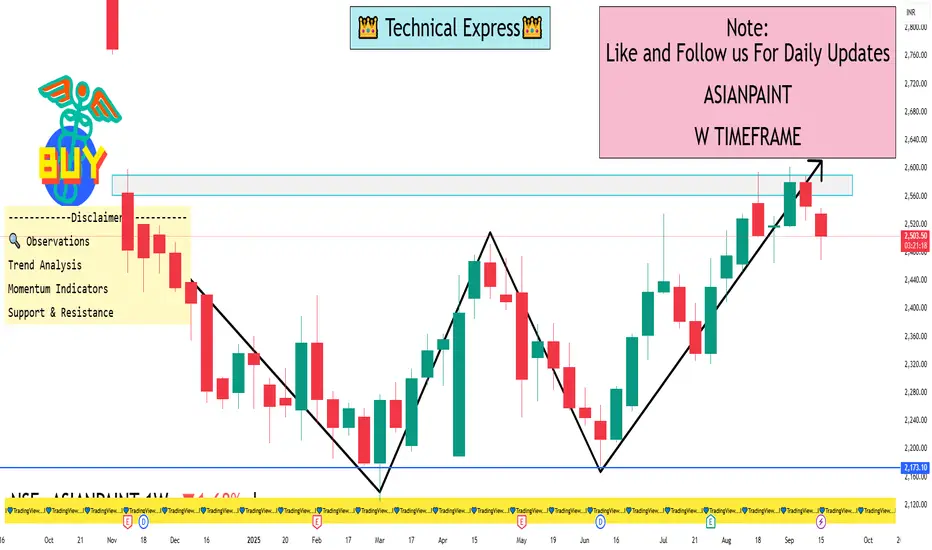
ASIANPAINT BULLISH SIGNALAsianPaint has been forming higher highs and higher lows inside an ascending channel pattern on the weekly chart. It might take support on the lower line of the ascending channel for the third time and we will wait for a candlestick pattern on the daily and weekly chart for confirmation. I will update a trade based on the future price action. Keep a lookout for an update.
PS - It might also try to fill the gap above the resistance of 2598.75.
Disclaimer - This is for learning purpose only. It should not be considered as a financial advice.

AsianPaints Descending Triangle PatternAsian Paints stock has formed a descending triangle pattern. It has started its 5th leg. The breakout on the upside will create a trading opportunity for a long.
Note: For educational and paper trading purposes only.

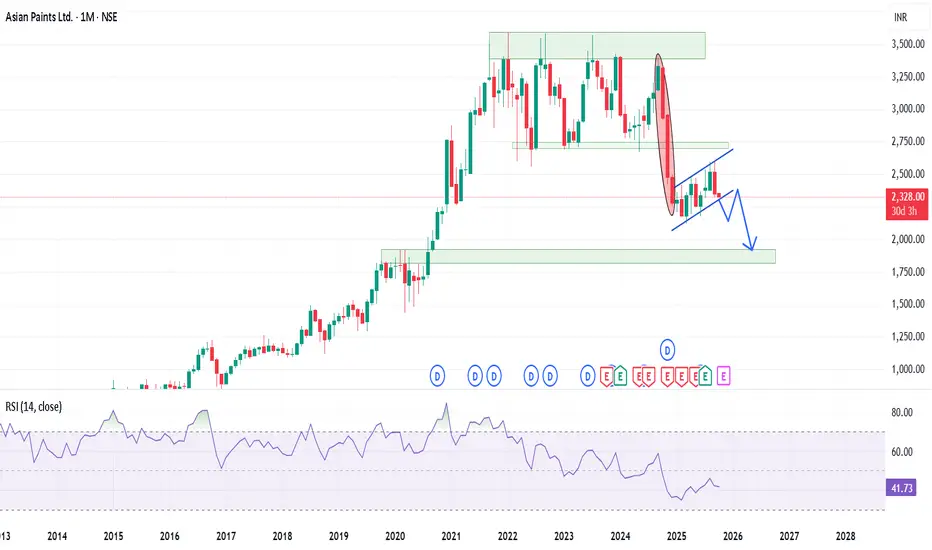
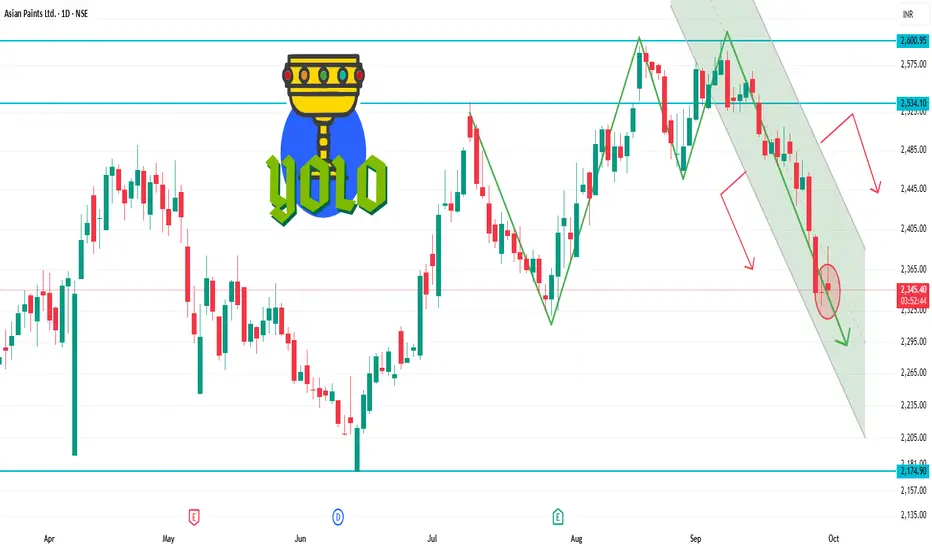
Good bearish setup on the higher time frame.Asian paints is one of the leading paint manufacturer in country and for the last few months the stock is trading in a parallel channel there are chance of it trying to retest the previous support zone of around 2700 levels before entering into another bearish leg.
Fundamentally stock shows some negativity as ~45% YoY decline in consolidated net profit in Q4 FY25.
Revenue slipped 4.3% YoY in this quater. Net profit fell 23.3% YoY in Q3 FY 2025.
Technically too the stock look to form bearish Flag and Pole pattern with a possible retracement to around 1700-1800 levels in upcoming months.
RSI is around in between on the monthly charts which is not in confluence.
BBand shows that the stock is trading below the median line of the band and chance of it travelling to the lower band it possible as stock it below the median line for around 11 months.
Exponential moving averages : 100 EMA on the monthly charts is providing good support to the stock while 20 & 50 EMA are acting as the resistance on the same time frame.
Target are different as per the trading setup.
Support and Resistance
Entry only once the channel is breached and retested.
Targe : 1815-1925 zone.
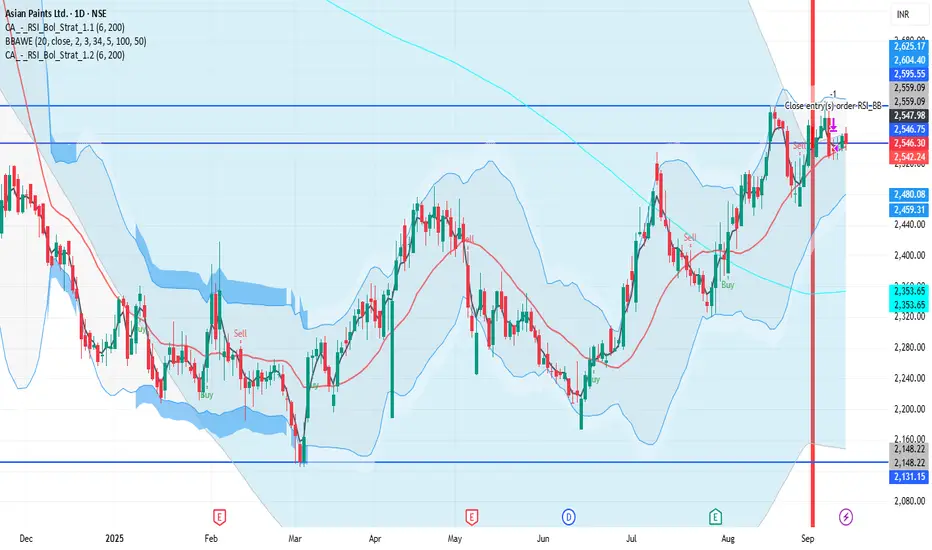
Bollinger Band
Entry has been triggered as per the BB strategy.
Target : 1935
EMA
As per the EMA strategy, there will be multiple entries in the stock.
Entry will be made once the stock closed below the 100 EMA.
Target : 200 EMA.
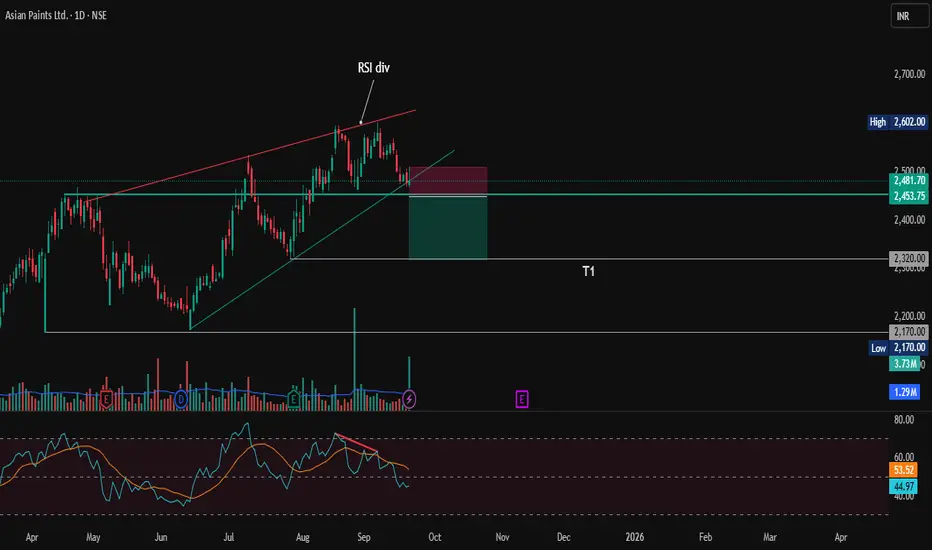
Asian Paints: Short Setup — Bearish Reversal SignalAsian Paints shows signs of a potential short opportunity after forming a bearish reversal pattern (Rising wedge) on the daily chart. The stock failed to sustain above the resistance near 2600, Formed a Double top pattern. The RSI is showing bearish divergence, signaling weakening momentum. hinting at a possible downtrend initiation.
Key Levels to Watch:
Immediate support at 2450 (swing low)
Further downside target around 2320 if support breaks decisively
Trade Plan:
Enter short below 2450 on confirmation of bearish candle close.
Stop loss above 2500 to limit risk from false breakdown.
Target 2320 for conservative exit or trail stop as price moves lower.
Disclaimer: Risk management is crucial in this volatile market, so keep position sizing appropriate. This analysis is intended for educational purposes and not financial advice.
ASIANPAINT 1D Time frameCurrent Price Snapshot
Current Price: ₹2,345.50
Day’s Range: ₹2,342.00 – ₹2,388.80
52-Week Range: ₹2,124.75 – ₹3,358.00
Technical Indicators
RSI (14-day): 44.19 — indicates a neutral to slightly bearish momentum.
MACD: -4.010 — suggests bearish momentum.
Moving Averages:
5-day: ₹2,396.00 — indicates a Sell signal.
50-day: ₹2,389.00 — indicates a Sell signal.
200-day: ₹2,350.00 — indicates a Neutral signal.
Technical Summary: Predominantly Sell signals across various indicators.
Summary
Above ₹2,388.80: Potential rise toward ₹2,400 – ₹2,420.
Below ₹2,342.00: Potential fall toward ₹2,320 – ₹2,300.
Between ₹2,300 – ₹2,380: Likely range-bound movement.
Asian Paints struggles to recover, trades near oversold zoneTopic Statement:
Asian Paints has shown a weak recovery from its recent correction and suffered further downside in Friday’s market drop, now hovering in deeply oversold territory.
Key Points:
1. The stock continues to receive strong support at the 61.8% Fibonacci retracement level
2. Price is currently trading below both the 50 and 200-day EMAs, signaling an oversold condition and a strong long-term buying opportunity
3. It is moving within a short-term mildly bullish channel, though the momentum remains subdued compared to broader market trends

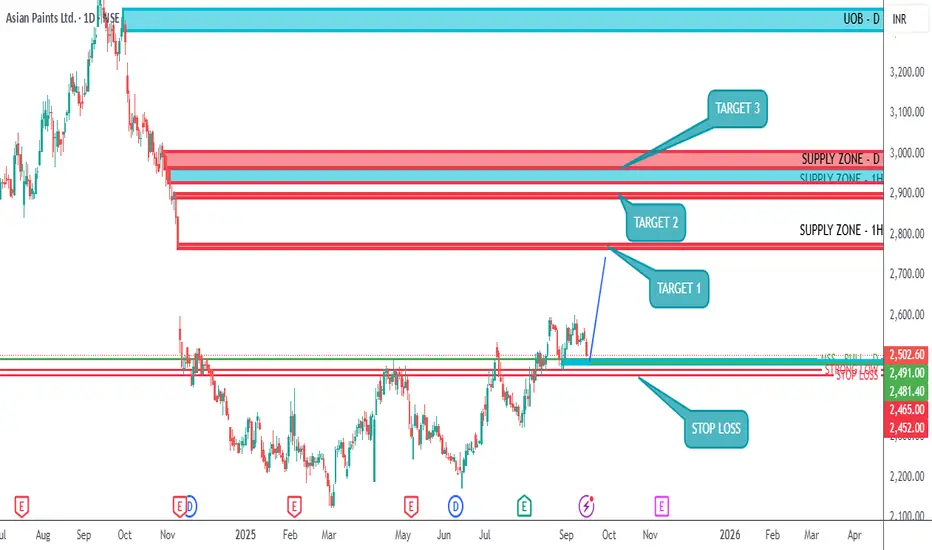
ASIANPAINT - BULLISH TRENDASIANPAINT is looking bullish with an uptrend towards 3000 mark in upcoming 4-5 months. ASIANPAINT has broken the Strong Lower High for a Market Shift of the Structure to bullish and moving towards 3000 mark very soon.
ASIANPAINT has many unmitigated order blocks and unmitigated supply zones at higher levels to be touched and processed.
Bought ASIANPAINT IN CASH at 2500 with a Stop Loss of 2440 for the first target of 2770 by next month and 2900 - 3000 in another 4 - 5 months.
📉 THIS CHANNEL IS ONLY FOR EDUCATIONAL PURPOSES.
Disclaimer: I am Not a SEBI registered analyst. I just share my positions to do paper trading and no where its a recommendation! Please do your own analysis before taking any trade.
ASIANPAINT 1D Time frame🔍 Current Status
The stock is trading around ₹2,490 – ₹2,500
Recent price action has been somewhat mixed — not a strong trend, some resistance in higher zones.
🧮 Trade Strategy Ideas
Long Setup:
If price holds above ~₹2,460 and shows reversal candlestick or volume strength.
Target resistance around ₹2,505-₹2,528.
Stop-loss could be placed just below ₹2,440 or so (to protect against breakdowns).
Short / Pullback Setup:
If price gets rejected near resistance around ₹2,505-₹2,528 and bearish candlestick forms.
Potential downside toward ~₹2,460 first, then further to ~₹2,420.
Breakout Setup:
If price breaks above ~₹2,528 with good volume, could aim for ~₹2,546 or higher.
Must confirm with strength / follow-through.
✅ Summary: Asian Paints is in a consolidation / neutral phase. Key to watch is how it reacts around the resistance zone ~₹2,505-₹2,528. Holding above support ~₹2,460 is important. A clear breakout gives upside, else downside risk remains.
ASIANPAINT 1 Week View📊 Weekly Support & Resistance Levels
Support Levels:
S1: ₹2,524.63
S2: ₹2,502.97
S3: ₹2,481.13
S4: ₹2,452.73
Central Pivot: ₹2,553.57
Resistance Levels:
R1: ₹2,568.13
R2: ₹2,589.97
R3: ₹2,611.63
R4: ₹2,647.13
Central Pivot: ₹2,553.57
📈 Technical Indicators (Weekly Timeframe)
Relative Strength Index (RSI): Indicates a bullish trend.
Moving Average Convergence Divergence (MACD): Shows a bullish crossover, supporting upward momentum.
Moving Averages: Both 50-day and 200-day moving averages are trending upwards, confirming a positive short-term outlook.
Pivot Points: Trading above the central pivot suggests a bullish bias.
🔍 Observations
Asian Paints has been trading within a parallel channel since May 2021. A significant gap-down breakdown occurred in November 2024, followed by a series of bearish candles. If the current momentum persists, further downward movement is possible. However, the stock is approaching key support levels, which may act as a cushion against further declines.
ASIANPAINT 1D Time frameCurrent View
The stock is trading around ₹2,490-₹2,500, roughly in that band.
Recent price action suggests sideways to slightly negative bias in the short term.
The stock is below many of its medium-to-long term moving averages, but above some short term ones — mixed signals.
⚙️ Indicators & Momentum
RSI is in neutral to slightly weak territory (not deeply oversold, not overbought).
MACD shows bearish pressure in recent periods.
Some oscillators & momentum tools showing mild divergence, meaning upward momentum is not strong.
Short-term moving averages are giving mixed signals: some support, some resistance.
📌 Key Levels to Watch
Resistance Zones: ~ ₹2,520-₹2,550 is a resistance range.
Support Zones: ~ ₹2,450-₹2,470 nearer support. More substantial support around ₹2,400-₹2,430.
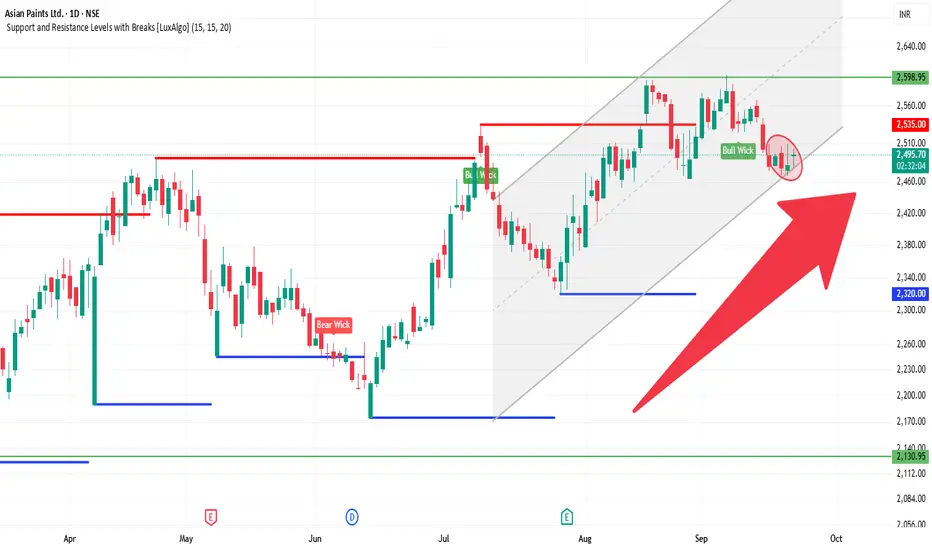
ASIAN PAINTS LTD ( 1D ) 🔑 KEY LEVELS 🔑
✔ Fibonacci Retracement 38.20%
✔ Trend Line Act as Support.
✔ RSI Also Oversold Zone.
🎯 TRADING PLAN 🎯
✔ Near the key levels , Bullish Harami
Candlestick Pattern has formed.
✔ The Entry Point is Above @ 2496.90
✔ The Stoploss Point is @ 2474.50
✔ The First Target is @ 2601.00
✔ The Second Target is @ 2705.00
💡 Discipline is the bridge between goals &
accomplishment.
Disclaimer : Educational & Informational
Purpose Only. Not a Buy / Sell
Recommendation.

ASIANPAINT 1D Time frameToday's Trading Range:
Day's Range: ₹2,498.00 – ₹2,543.50
Opening Price: ₹2,535.10
Previous Close: ₹2,540.50
52-Week Range: ₹2,124.75 – ₹3,394.90
📈 Circuit Limits:
Upper Circuit Limit: ₹2,800.90
Lower Circuit Limit: ₹2,291.70
ASIANPAINT 1D Time frameCurrent Status
Price: ~ ₹2,546
It is well below its 52-week high (~₹3,394) and above its 52-week low (~₹2,125)
Market capitalization is large; the stock is considered a large-cap, stable name in decorative paints
Key Metrics
P/E (TTM) is high (≈ 67-70) → indicates expensive valuation relative to earnings
P/B is also elevated (≈ 12-13)
Return on Equity (ROE) ~ 18-20% — reasonable, not exceptional but solid
Bullish Scenario
If Asian Paints can reclaim and hold above ~₹2,550-₹2,600, it may move toward retesting higher resistance levels around ~₹2,750-₹3,000
ASIANPAINT 1D Time frameCurrent Price & Trend
Price: ₹2,546.30
Trend: Consolidating near recent highs; trading approximately 25% below its 52-week high of ₹3,394.90.
Momentum: Indicators suggest a neutral to slightly bearish outlook.
Bullish Scenario
Breakout Above ₹2,580: A sustained move above ₹2,580 could target ₹2,600 – ₹2,620 in the short term.
⚠ Bearish Scenario
ASIANPAINT 1D Time frame📍 Current Price
₹2,546.30 (closing price)
Short-Term Outlook
Bullish Scenario: A sustained move above ₹2,587.40 could lead to a test of the 52-week high around ₹3,394.90.
Bearish Scenario: A drop below ₹2,505.00 may signal a potential pullback toward ₹2,400.

ASIANPAINT 1D Time frame🔢 Current Level
Trading around ₹2,546 – ₹2,560
🔑 Key Resistance & Support Levels
Resistance Zones:
₹2,559 – ₹2,560 (recent highs; breakout above this may lead to further upside)
₹2,580 – ₹2,600 (stronger resistance above)
Support Zones:
₹2,540 – ₹2,545 (immediate support; failure to hold above this may lead to a decline)
₹2,520 – ₹2,530 (short-term support; a break below this could indicate weakness)
₹2,500 – ₹2,510 (deeper support zone if price dips further)
📉 Outlook
Bullish Scenario: If Asian Paints holds above ₹2,545, upward momentum may continue. Break above ₹2,560 can open the way toward ₹2,580+.
Bearish Scenario: If it falls below ₹2,520, risk increases toward ₹2,500 – ₹2,510.
Neutral / Range: Between ₹2,545 – ₹2,560, Asian Paints may consolidate before a directional move.
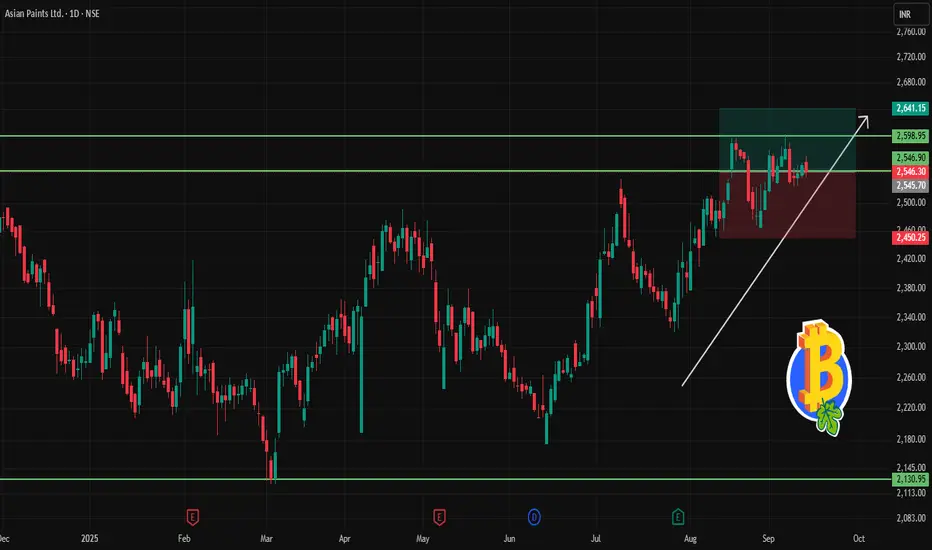
Gap filling will startThe stock has created a gap and will start filling it if we check the weekly price action.

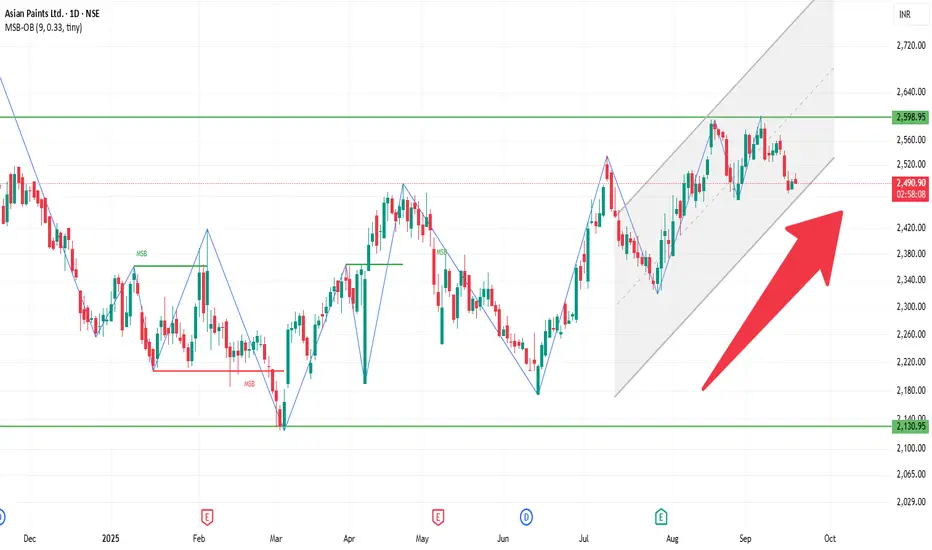
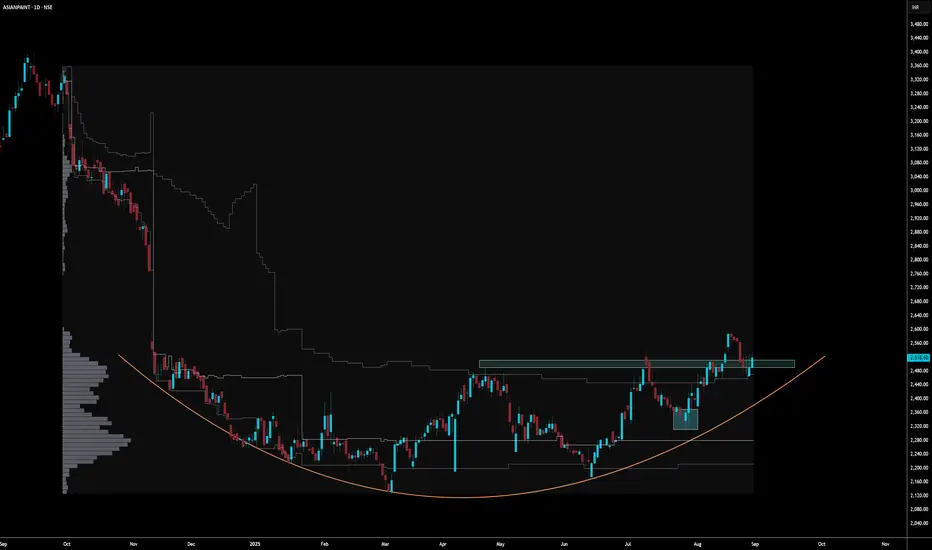
#ASIANPAINT... solid base formation .. getting ready for a move Stock has formed a solid base after the mega fall in November last year. the recent break of the zone with volumes indicates good market participation and the stock expected to make a move up again, on my radar in the coming days .
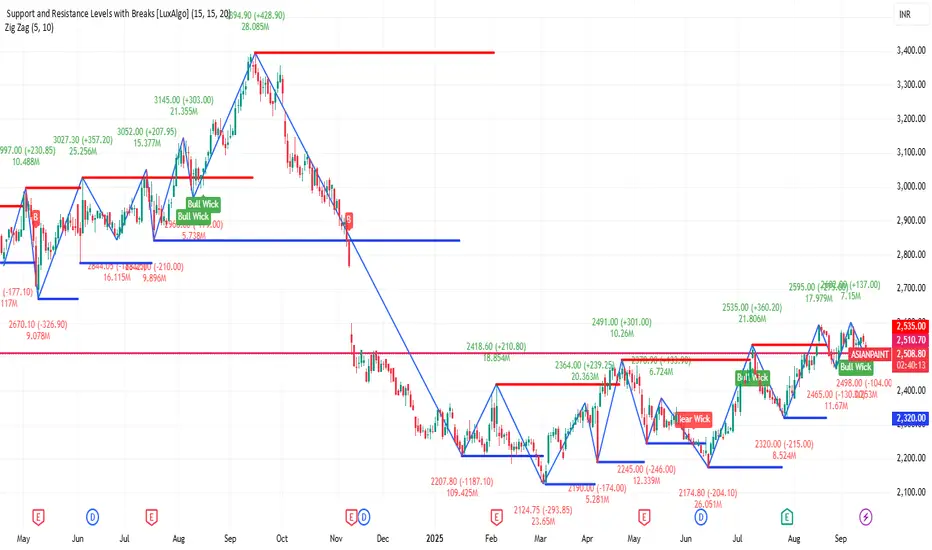
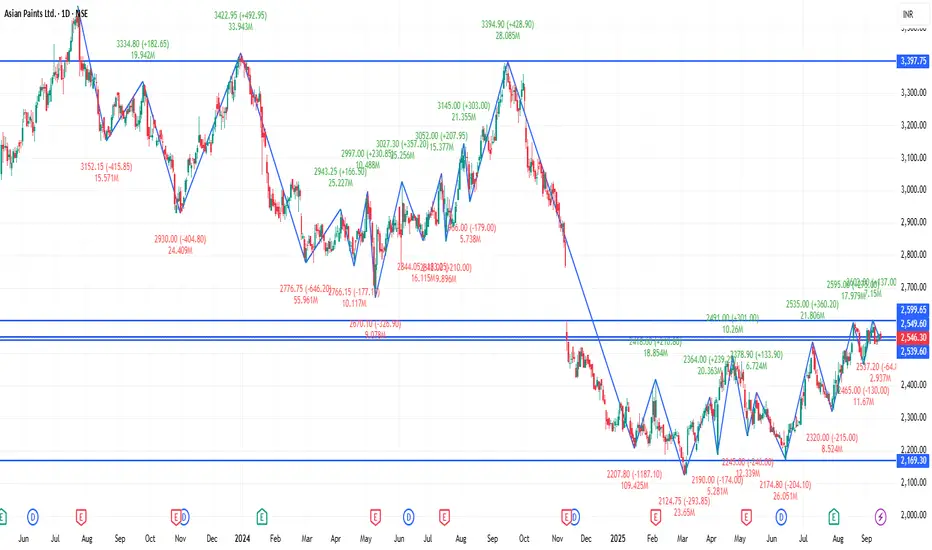
Asian Paints: Wave 3 Breakout or Wave 4 Still Dragging?Asian Paints seems to have completed a prolonged higher-degree wave 4 correction at ₹2124, marked by a complex overlapping structure. The subsequent rally has shaped into a 1–2, 1–2 sequence, pointing to the possibility of a strong wave 3 breakout. RSI momentum has been steadily rising since the ₹2124 low, and volume expansion adds weight to the bullish case.
However, the price now faces a strong resistance band just overhead. For the bullish impulse to remain valid, wave 3 must cut through this zone decisively. Failure to sustain above it could indicate that wave 4 is still extending sideways, possibly evolving into a triangle or another complex form before the final push higher.
The bullish invalidation remains at ₹2124 — any breakdown below this level would cancel the impulsive view and shift the bias toward further correction.
Disclaimer:
This analysis is for educational purposes only and does not constitute investment advice. Please do your own research (DYOR) before making any trading decisions.
