ASIANPAINT trade ideas
Festival season : U turn Asian paints has bounced from support and showing signs of reversal. It probably can rally upside due to upcoming festive season demand esp in Home decor segment.

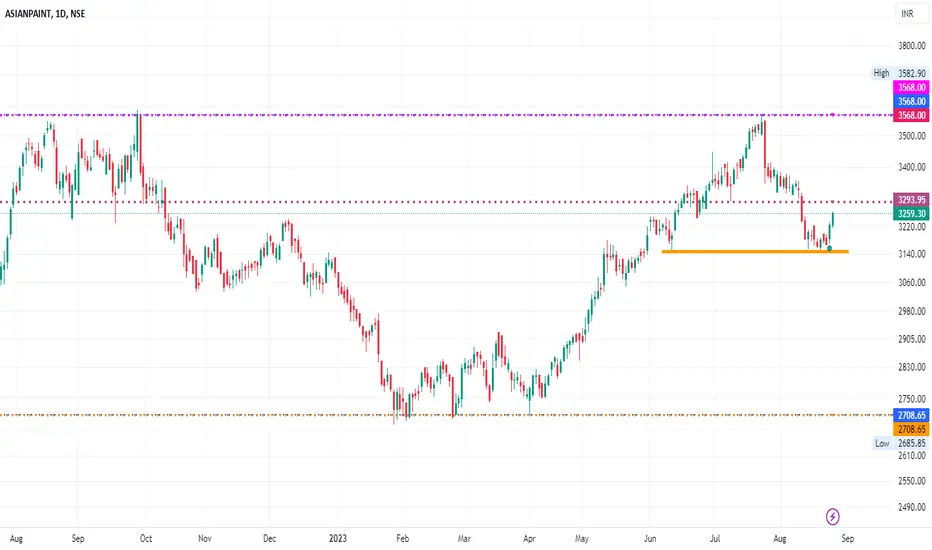
A good buy for investors!ASIAN PAINTS has retraced 50% from it's recent high of 3568. The RSI has also cooled off and the stock seems to be making a bottom now at 50% retracement/200 EMA.
This looks like a good RR set-up for investors - No Intraday here.
Buy above 3250 on day closing basis. Put SL below 3130 day closing basis.
One can hold this and trail till 3568 level.
Learn & Earn,
Dr. Tanya Kumar

Asian Paints Short Term TradeThere is a bearish breakout in asian paints, with a high vol confirmation on breakout candle
Tgt and SL are marked on chart

Asian Paints - Life time Analysis 3,185.35 critical Level
Two parallel lines drawn in sky blue color are important. Buy only if the upper line is broken. Please check my other posts on the Asian Paints. Link provided.
The Author uses Gann, Fibonacci and Wave Analysis along with his personal unique indicator which avoids complex PTV (Price - Time and Volume Analysis).
Analysis is one part and the other most important part is execution. Please use Williams R%, RSI and SMA, EMA for proper execution in lower time frames of 4h, 1H and 15 minutes.
Disclaimer: I am not a SEBI Registered Analyst. It is just for educational purposes. Before making any decision, please consult your financial Advisor.
Happy to share. Let you grow and I may also, following you.
Thank you

Asian PaintsAsian Paints
Post decent fall from highs
Now near 50%` Retracement levels
Looking good for both short term swing moves.
Keep an eye
Buy between 3160-3130
SL below 3100
Target 3310/3400
Decent risk to rewards, worth taking

ASIANPAINTASIANPAINT
Buy above 3250
SL below: 3114
Targets: 3354/3469/3547/3582/3678/3822/3999/4009 +
Multi-month Cup &Handle formation.
Retesting 200 EMA on DTF
Posted strong quarterly results recently and shown health correction of upto 15% post earning release.

Asian Paints- Complete Analysis and Execution
Why we fail. Because, once we see a level; jump into the trade immediately and market turns the other way round.
There are two parts of trading/investing/swing trading or intraday:
1. Analysis
2. Execution.
Analysis is important and sometimes we may work on the judgement of other analyst also. But, execution is the thing which we have to do. There we fail. Let me tell you that to succeed execution has more weightage than analysis. Let me use the as an opportunity and let you know how to trade.
Have a look at IH Chart and the rectangle drawn by me.
Lets analyse it in following steps:
1. Price fell till the level of 3152.25 till 9:15 on 14th August 2023.
2. Made a high at 9:15 on 17th August 2023.
3. Now, the intention of big players may be to go long from this level but this will not happen immediately. Will take some time, why? Because the big boys have to collect a desired level of the stocks at this price and then sell it to small investors at a high desired price giving them a decent return. This is called the Accumulation phase in terms of Wycoff Theory.
4. Now, how this will happen, let us understand. In terms of Elliot wave Theory, it is called formation of ABC Ways. Lets deep dive and understand.
5.You can see that for the last 7 days (time analysis) price is stuck within this rectangle (price analysis) and the smart money is trying to accumulated the stocks within this range to sell/distribute to retailers are the higher price. for this we will have to do the volume analysis. In short, we have to read volume at all the levels or take the help of SAMs/ EMAS. In all the cases, price will exceed firstly SMA8, then 20, 50. 100 & 200. this process with take around 14 to 21 days and then the price will shoot up above high of previous swing. There we have to buy. How volume analysis is and risk management is done, we will discuss somewhere in next post. Patience is the key. Learn and Earn.
Conclusion: If the price of Asian Paints has to reverse from this level, please read 1H or lower time frame chart and wait for next 2 to 7 days and you will succeed.
Happy to share. Let's grow together.

200 ema support + dabble bottom (loang)buy for sort SL and big profit SL below 3145 for more than 1:2

Asian Paints-
Asian Paints found its support on the highs of previous swings making double Bottom at 3152. But, did not Bounce above 3218. Stuck within these two limits. No long decision till it re -bounces above white line. Till then stay away from long.
For execution, please use William %R, RSI and other indicators like EMAs, SMAs etc; and stick to proper risk management.
This content has been generated only for educational purposes . There is no recommendation to Buy or Sell. Author is not a SEBI Registered Analyst. Please consult your Financial Advisor before making any decision.
Happy to share. Together we grow.

Asian Paints Bullish Set upBullish Divergence at Play for Asian Paints
Stop loss of 3100s
Target of 3350s
Bullish Hidden Divergence
Small Risk & Big Reward Set up

Asian Paints next Level for accumulation.One can take decision based on the charts. Go long once important support tested.

asian paint - buy on dipsTBuy from cmp to 3326
sl close below 3323
easy tg - 3375
tg2 - 3400
Disclaimer : This is my personal analysis for study purpose not intended for trading.

asian paint asian paint daily chart up/dn ?? but some sure big movment possible in either side but technically its downtrend pole n flag

Ascending Triangle in Asian Paint.NSE:ASIANPAINT
The Stock has been consolidating for almost 2.5 years and it has formed a ascending triangle formation which can trigger a breakout and start a trend continuation and take the price to new highs.
The Targets are projected on the basis of fib-extensions.
All important levels and logic is explained on chart.
I hope you found this helpful.
Please like and comment.
Keep Learning,
Happy Trading!

Conditions apply buyVery good buying seen in this counter, but crude oil is vilan for it I m buying only above3600, today also results day

Asian Paints hedge Trading Strategy As per OI Data and Volume Analysis We can Do Hedge Position in Asian Paint this is purely Result Base Strategy only for Tracking
Buy Asian Paints 3540 CE Near 50, Stop Loss 35 and buy Asian Paints 3500 PE Near 33, Sl 20
Investment required 17000
Maximum Loss - 2000
Profit upto 3500

Asian Paint.....Target 3530Asian Paint ...Cup and handle pattern .....Entry 3250....Target 3530...Sl 3090

BULLISH HARAMI CANDLE IN ASIANPAINTSBullish Harami with Volumes in Daily TF
Made at breakout retest zone
Inv Head and Shoulder can be seen.
Breakout on 12th June was also with volumes.
Entry can be at CMP with Target 3400
SL below previous day Red candle at 3240

asian paints- long weekly chart shows IB formation
likely to break all time high
10 % minimum target from current price

ShortAfter very good run up, this counter looking weakness maximum up side 3425 to 3450,
Crude oil also 80$, very negative for paint stock
If last hours low break then we can see sharp down move of 3% minimum,

Looking for Long In ASIAN PAINTS for the upcoming financial year+ stoploss is Less from the current level and reward is high
+ fundamentally good stock available at discounted discount
+ #harmonic pattern suggest reversal signal on long side
+ trade with proper logic and not greed

asianpaint towards an all time high! the paint giant with a 60% market share
after a tough year
again marching towards an all time high arena
