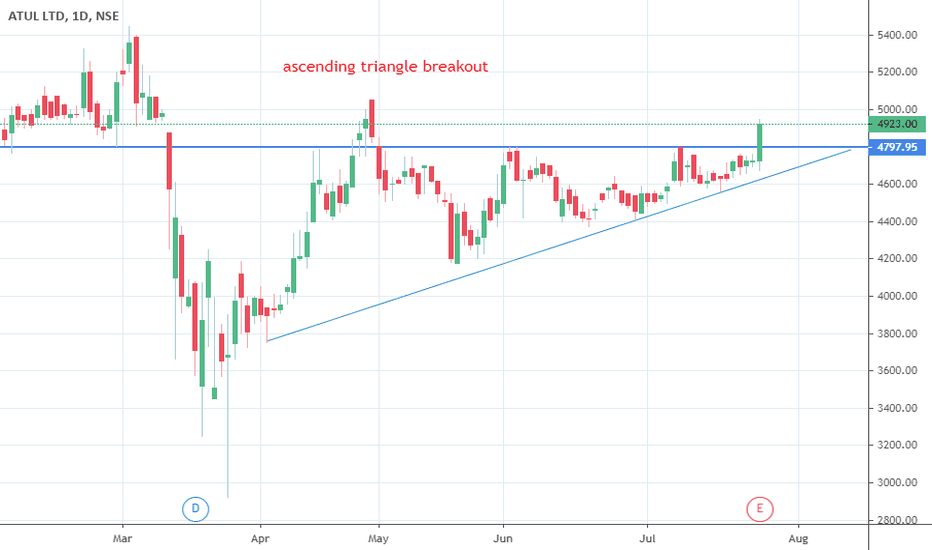
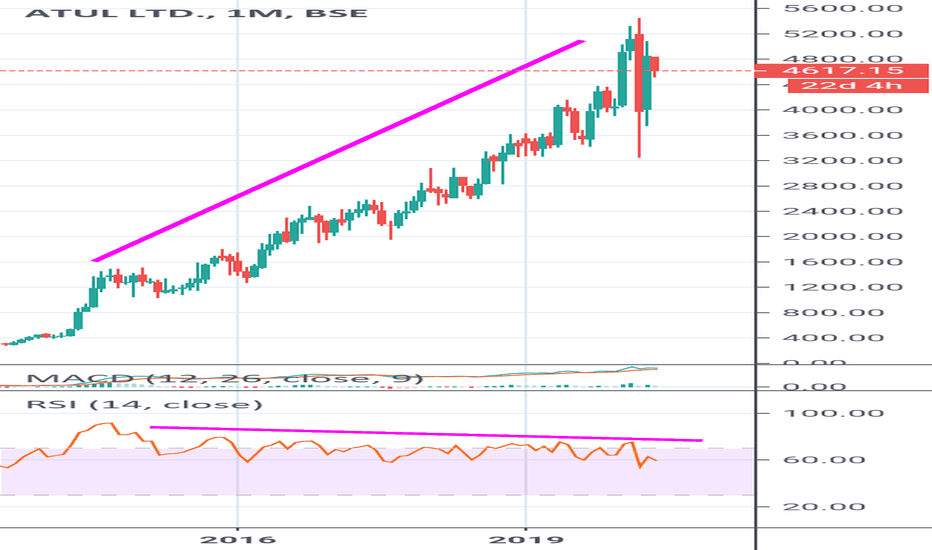
Atul Ltd : Good up move expected in Long TermAtul is bullish for long term for a target of 5000, 5400, 5700+. Views are for educational pupose only.Longby TMugemboUpdated 1
Buy Atul 4745 -4750Technical Trade - Atul has been consolidating above 50DMA. Price is around the 61.8 retracement level. Down days are on extremely low volume and up days are on higher volume. Price is contracting. I will be buying above 4745. This stock has great fundamentals. Longby InfinityCapitalUpdated 1
Atul Ltd. looks weak and retracingAtul ltd has currently taken support at 4500 but seems it will break this and reach 4250 or 4000 before continuing the larger up-trend. Would wait to see the consolidation play out before initiating any fresh buy positions.Shortby custardapplepy112
Extremely bearish in Atul ltd. 1200 possibleAtul ltd looks strong bearish due to price and RSI making a negative divergence. Another reason is supply and demand. Both technical and fundamental reason is too weak to support this. Shortby uniproadvisory0
#ATULUp Up and Higher! Into the new levels Momentum of All TF BoxBO Detcted by kkonline.org/nimblrta Keep riding it until CCI 34 30 becomes < -100 by krishnakhanna2
Atul ltd (momentum entry @ 3500-3600)Atul ltd is making 52 week high every year even in bearish market condition.momentum of stock is still upside with small risk , Entry @3500-3600 Sl Close below 3400 Target will be updated on monthly basis.Longby uniproadvisory0
#ATULRequires a strength candle with H> 3658.95 and C > 3645 on Weekly basis for a BoxBO by krishnakhanna0
#ATULWeekly CCI cross 100 Pinbar is broken with strength Move towards 3697.70 SL 2830.10Longby krishnakhannaUpdated 2
Investment idea in ATUL on NSE (INDIA)This is weekly chart of ATUL on NSE (INDIA) which looks an excellent investment idea based on following observation: 1. It is up trending scrip which is quite obvious by looking at chart. CMP is 3304.65) 2. Two trendlines have been drawn which have been tested many a times exhibiting multiple supports (shown by arrows) 3. Dividend has been paid in July 2018 (Rs 12/-) 4. Resistance at 2560 was decisively broken on 18th Dec 2017 which subsequently acted as support and was tested on correction on 5th Feb 2018. Price then consolidated during 5th Feb 2018 to 20th Aug 2018 and finally given fresh breakout on 27th Aug 2018. Price subsequently tested EMA20 on 1st Oct 2018 which acted as support. It therefore establishes that EMA 20 will act support in near terms on weekly chart on closing basis. 5. Bullish crossover has been witnessed on Stochastic RSI as marked on the chart. In view of above, it looks an excellent idea to invest in this stock on long term basis keeping initial stop at 2800 and then trailing as price move further towards north. Trailing stop could be weekly closing below weekly EMA20. Happy investing !!! Longby DEVERAMA0