Simple Interpretation of Volume Footprint ChartsVolume footprint charts can be called as 'the eyes and ears' of the market. They truly reveal where the big orders are getting executed, the outcome of those orders and the possible future course of action.
To keep things simple, we may breakdown volume footprint charts with just two interpretations:
↳ Buyers may be interested in higher prices
Big orders and good bullish candle close or long wick at the bottom with higher close.
↳ Sellers may be interested in lower prices
Big orders and a bearish candle close or long wick at the top with lower close.
We can apply this interpretation to the key levels in the market to see which side is strong- buyers or sellers?
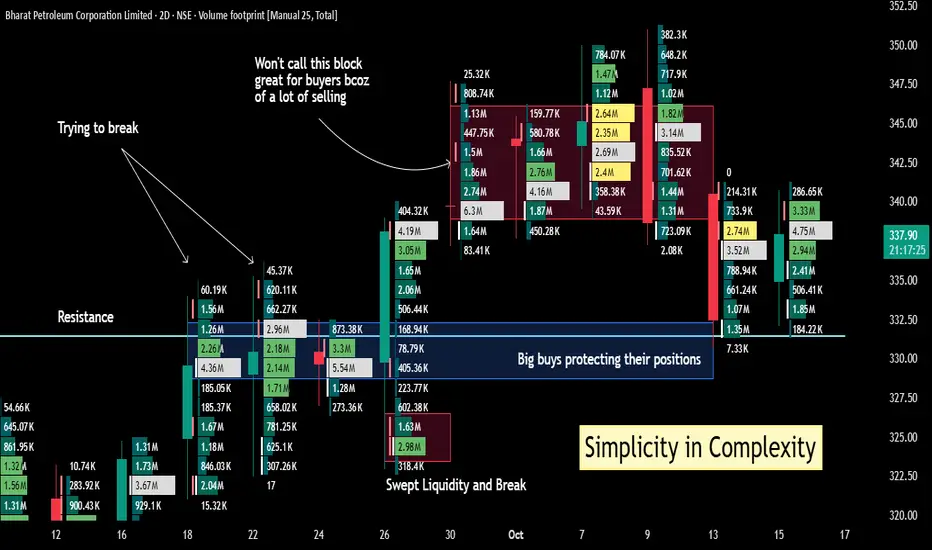
In this little backdrop, let's discuss the above chart.
It's a 2days chart of BPCL (I did that to accommodate more price action).
On a simple candlestick chart, you would see a breakout retest of 331 and the price is holding- giving a nice pullback trade if you missed the breakout trade.
However, footprint chart gives us more information about what is happening where.
First of all, the stock struggled near 331 resistance level even when the volumes were higher. Finally, it swept below a day low and broke out of resistance with good volumes.
Now what happened after the breakout of 331 blue resistance line?
Big-big orders were there but no good result. Hardly any candle with strong closing after the BO candle. This only means that sellers were active in the zone.
Then the price broke the 8-session low and notice big orders 2.74M and 3.52M at the break in the second last candle on the right. That's good for sellers, right?
But the big boys who were buying before or near the BO of 331 are now trying to protect their positions and hence the retest holds.
We have big orders in the same area- 3.33M, 4.75M and 2.94M shares traded though there is still one more day for this candle to close. We will get more information on it tomorrow.
If the price rallies from here, surely those who were selling in the 340-350 zone will try to protect their positions too and the ride may not be that smooth. More updates in the coming days.
This way footprint charts give more confidence if you are in a trade. It gives you a reason to enter or hold a trade.
Many times, keeping things simple works best in trading. Clear and straightforward analysis without extra indicators can give the good results.
But do you know one thing?
Every setup or edge works with a good position management and trade management. Otherwise, the best of the best trade may end up in a loss.
Trade safe, stay healthy.
Disclaimer: I don't have any position in this stock, and this is not a buy sell recommendation. This post is just for educational purpose.
Trade ideas
Swing Trade | BPCL – Price Hovering Near Support Zone📌 BPCL – Price Hovering Near Support Zone
BPCL is currently trading around a critical support band between ₹327.85 and ₹332.70.
- 🟡 Demand zone marked with historical buying interest
- 📉 Recent price action shows a mild pullback, testing lower boundary of support
- 🔍 Watching for bullish confirmation or consolidation signals
- ⏳ Time-based exit logic applies — no stop-loss or target set
- 🔁 Stocks are rotated based on new opportunities or holding period expiry
- 💧 Selected from Nifty 200 universe for liquidity and reliability
- AMO Order placed at tomorrow market open.
- Will exit the stock before 14 days.

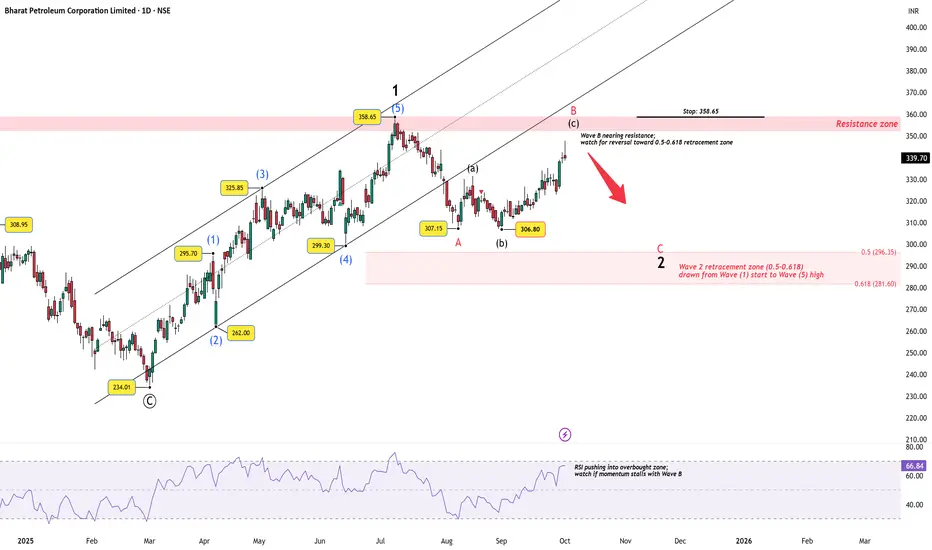
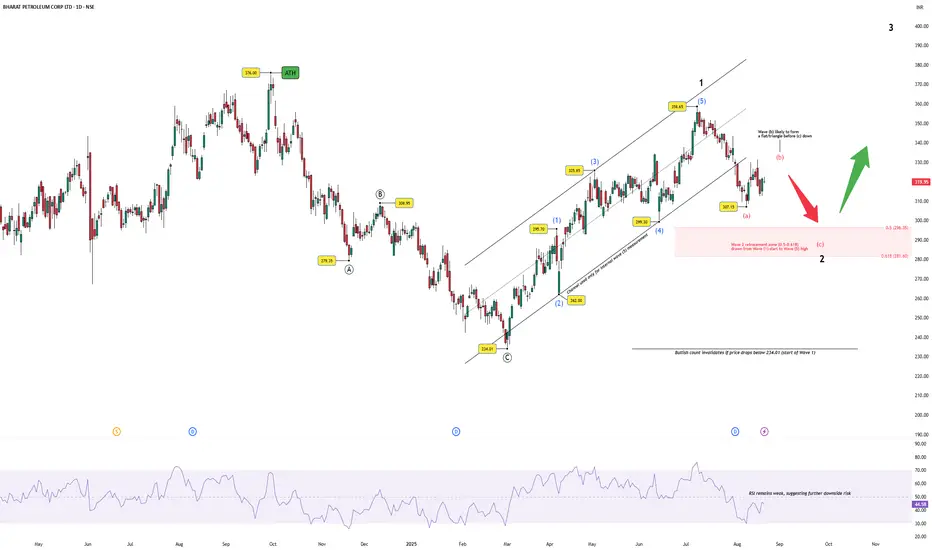
BPCL– Wave B Nearing Resistance, Wave 2 Correction Still in PlayBack on August 20, I highlighted that BPCL had completed a 5-wave advance from 234.01 to 358.65 , marking higher degree Wave 1, and that a corrective Wave 2 was in progress. (Earlier technical analysis write-up is attached here: )
At that time, only Wave (a) of the correction was visible. Since then, price action has unfolded further:
Wave B is now rising into a strong resistance cluster near 350–358.
Unless price decisively breaks above 358.65 , the move remains corrective.
A final Wave C decline into the 0.5–0.618 retracement zone (296–281) remains the higher probability path.
Momentum check: The RSI is pushing higher alongside Wave B, but if momentum stalls here, it would confirm the setup for a downward leg.
Key Levels:
Resistance / Stop: 358.65
Retracement Zone: 296 – 281
Summary: The corrective roadmap outlined in August is still intact. With Wave B nearing exhaustion, focus now shifts to a potential Wave C decline toward 296–281, before the larger bullish structure resumes with Wave 3.
Disclaimer: This analysis is for educational purposes only and does not constitute investment advice. Please do your own research (DYOR) before making any trading decisions.
BPCL 1D Time frameCurrent Price Snapshot
Last Traded Price: ₹340.20
Day’s Range: ₹337.15 – ₹340.85
52-Week Range: ₹234.01 – ₹373.35
Technical Indicators
RSI (14-day): 53.27 — indicates a neutral momentum.
MACD: 2.49 — suggests a bullish trend.
Moving Averages:
5-day: ₹327.97 — indicates a Sell signal.
50-day: ₹322.14 — indicates a Buy signal.
200-day: ₹296.14 — indicates a Buy signal.
Pivot Points:
Support: ₹327.13
Resistance: ₹337.93
Summary
Above ₹340.85: Potential rise toward ₹345 – ₹350.
Below ₹337.15: Potential fall toward ₹330 – ₹325.
Between ₹330 – ₹340: Likely range-bound movement.
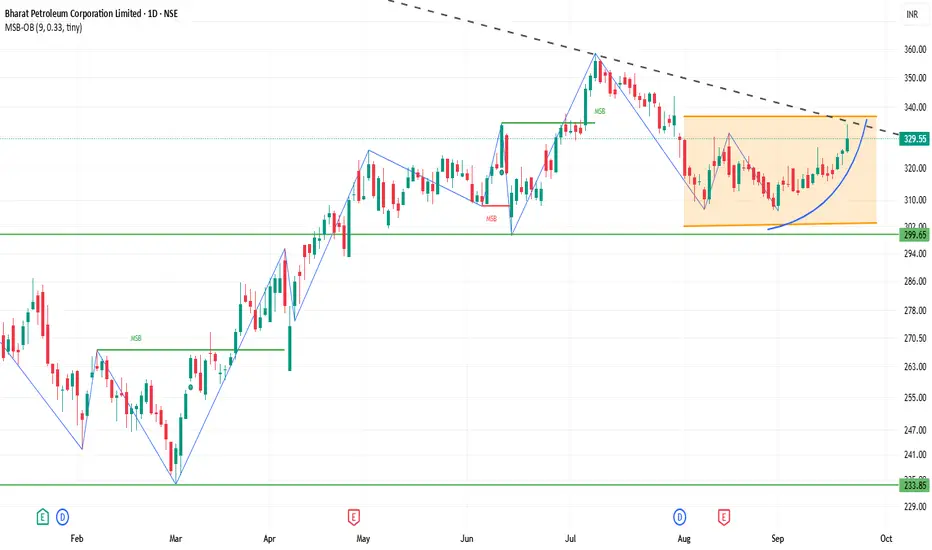
BPCL 1D Time frame📊 Current Snapshot
Closing Price: ₹329.55
Day's Range: ₹324.80 – ₹334.00
52-Week Range: ₹234.01 – ₹376.00
Market Capitalization: ₹1,42,975 Crores
Volume: Approximately 10 million shares traded
P/E Ratio: 8.14
Dividend Yield: 2.99%
⚙️ Technical Indicators
Relative Strength Index (RSI): 60.31 – Neutral to slightly bullish
Moving Average Convergence Divergence (MACD): 0.29 – Neutral
Moving Averages: Short-term averages (5, 10, 20, 50, 100, 200-day) are above the current price, indicating potential resistance.
Pivot Points: Central pivot around ₹322.30, suggesting a balanced market sentiment.
🎯 Possible Scenarios
Bullish Scenario: A breakout above ₹328.25 with strong volume could target ₹331.80 and higher levels.
Bearish Scenario: Failure to hold above ₹325.85 may lead to a decline toward ₹322.30.
⚠️ Key Considerations
Market Sentiment: BPCL has shown strong performance recently, but broader market conditions can impact its movement.
Volume Analysis: Watch for volume spikes to confirm breakout or breakdown signals.
Technical Indicators: While the RSI indicates a neutral to slightly bullish stance, the MACD and moving averages suggest caution.
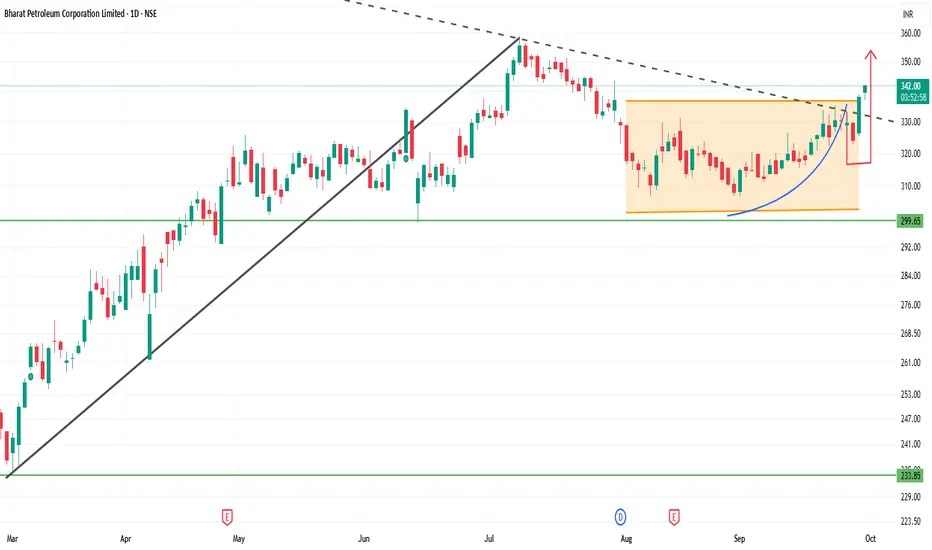
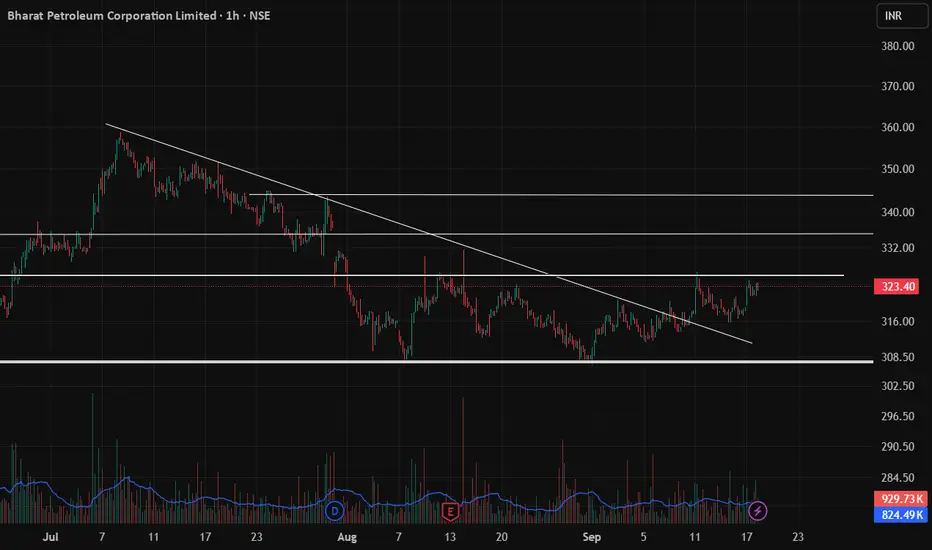
BPCL Chart AnalysisBPCL is trading around 323, showing signs of strength after breaking out from a falling trendline. The stock has been consolidating and is now retesting the important resistance zone of 325. Sustaining above this level could open the way for further upside towards higher resistance zones.
🔑 Key Levels:
✅ Support: 318 / 310
✅ Resistance: 325 / 334 / 342
✅ Trend: Recovering from downtrend, moving into consolidation-to-bullish phase
📈 The breakout from the downtrend line indicates reduced selling pressure and renewed buying interest. A strong close above 325 with volume confirmation could trigger momentum towards the next resistances.
⚠️ This analysis is for educational purpose only, not a buy recommendation.
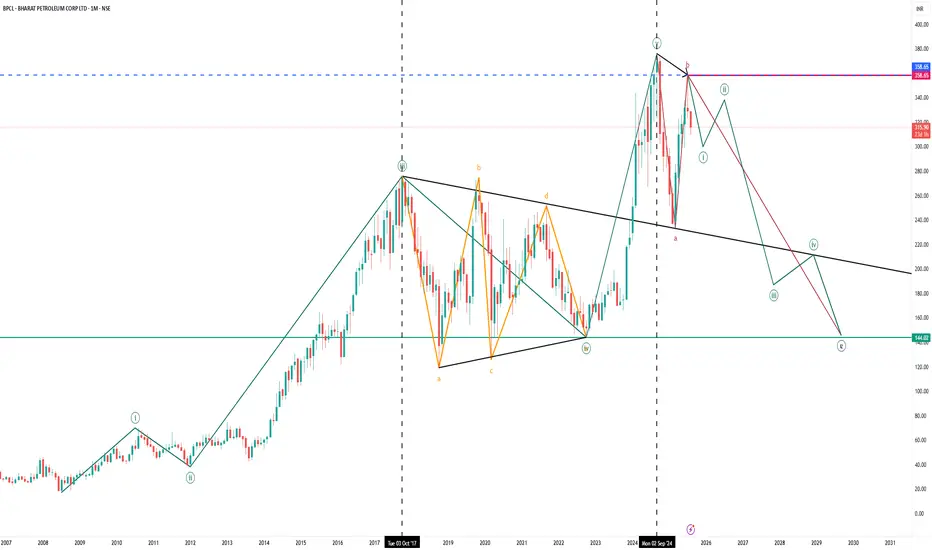
BPCL – Wave 2 Correction in PlayBPCL has completed a clear 5-wave advance from the 234.01 low to the 358.45 high, marking higher degree Wave 1. Price is now unfolding a corrective Wave 2, with Wave (a) already in place.
Wave (b) is likely to take shape as a flat or a triangle before a final Wave (c) down .
The retracement zone (0.5–0.618) from the Wave (1) start to Wave (5) high lies between 296–281, which is quite typical for second waves.
RSI remains weak , suggesting that further downside into this zone is probable before the next leg higher begins.
Invalidation : The bullish count fails if price drops below 234.01 (start of Wave 1).
Overall, the setup favors a corrective pullback completing within the 296–281 zone, before a potential strong Wave 3 rally unfolds.
Disclaimer: This analysis is for educational purposes only and does not constitute investment advice. Please do your own research (DYOR) before making any trading decisions.
BPCL 1D Time frame📍 Current Price
₹318.00 (closing price)
Short-Term Outlook
Bullish Scenario: A sustained move above ₹322.65 could lead to a test of the 52-week high around ₹376.00.
Bearish Scenario: A drop below ₹312.30 may signal a potential pullback toward ₹300.00.

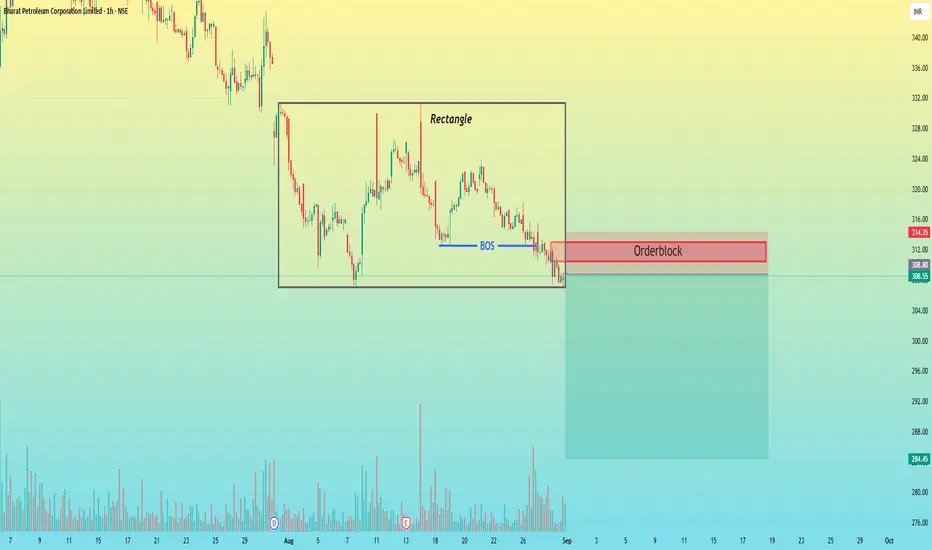
BPCL – Break Of Structure & Order-block Retest | Bearish Setup📊 BPCL (1H) –
After a prolonged sideways move inside a Rectangle pattern, BPCL has shown a clear Break of Structure (BOS) to the downside. This indicates that buyers lost control and sellers are currently dominant.
🔎 Key Observations
Rectangle Range: Price was consolidating between ₹330 – ₹308 for several sessions.
BOS Confirmation: Breakdown occurred below ₹310, validating a bearish bias.
Orderblock Retest: Price is now retracing back to the supply zone (₹310–₹315). This zone overlaps with the last bullish candles before the breakdown, making it a high-probability rejection area.
Volume Profile: Noticeable increase in volume during the breakdown, which further supports bearish strength.
📉 Trading Plan
Entry Zone: Current Market price 308
Stop Loss: Close above 315
Targets:
T1: ₹300 (psychological round level)
T2: ₹292
T3: ₹285 (major support level)
⚠️ Risk Management
Always manage position sizing. The stop loss is tight compared to potential reward, giving a favorable Risk:Reward ratio of ~1:3.
📌 Invalidation:
If BPCL sustains above ₹315 with strong bullish candles, the bearish setup is invalid, and we may again see consolidation or reversal.
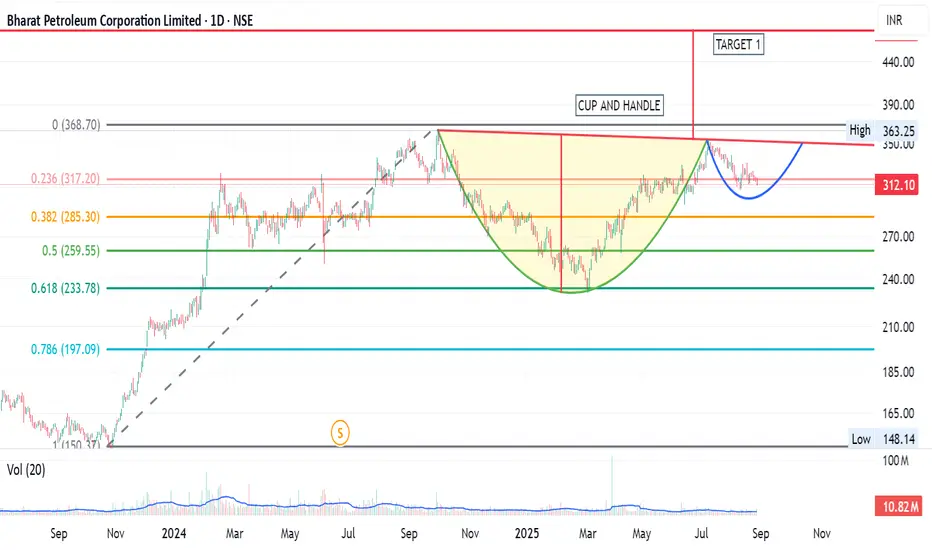
Cup and Handle forming in BPCLThe stock is forming Cup and Handle formation. It has exactly retraced from 61.8% levels of its last larger swing fall.bounced back and now forming a Cup and Handle. May be might take few days. Lets see, how it unfolds.Rest targets will be updated as chart unfolds. good luck. TY . JUST FOR LEARNING AND EDUCATIONAL PURPOSE. JMK
BPCL Long Trade Setup: 3:1 Risk/Reward Reversal Play
Analysis
BPCL has shown a potential reversal after a significant downtrend, with a clear break of structure and liquidation of sell-side liquidity. The chart marks a key Fair Value Gap (FVG) entry zone, aligning with a bullish momentum confirmation and a strong recovery from recent lows.
Trade Parameters:
• Entry: After confirmation from FVG/volume imbalance area
• Stop Loss: ₹306 (below recent swing low for risk protection)
• Take Profit: ₹360 (targeting next key resistance zone)
• Risk/Reward Ratio: 3:1
Disclaimer
This idea is for educational purposes only and does not constitute financial advice. Trading involves risk—always do your own research and consult with a professional advisor before making trading decisions. Past performance is not indicative of future results.

BPCL – Swing Trade IdeaBPCL – Swing Trade Idea
Buy: ₹320
Stop Loss: ₹307 (closing basis)
Target: ₹350+
Time Frame: 1 Day
Setup: Price taking support near the 200 EMA, indicating potential upside momentum.
Disclaimer: This is for educational purposes only, not financial advice.

BPCL : Correction to start ?Elliot Wave Impulse Complete ( 1-2-3-4-5)
Elliot A & B is Complete, and C to start.
Bearish Divergences Observed.
BPCL – Swing Plan | 14 Jul 2025BPCL – Swing Plan | 14 Jul 2025
CMP 344.80
🔸 Resistance 352.75 / 357.90
🔸 Support 344.00
💚 Buy
• Reversal from 343–344 zone → tgt 349 / 352 (SL 341.5)
• Fresh long above 352.8 → tgt 357+ (SL 349)
❤ Sell
• Below 343.5 → tgt 340 / 337.5 (SL 346.5)
⚠ Neckline + trendline confluence zone — key reaction expected.
💡 Close above 352 = bullish "W" breakout setup.

Bharat Petroleum Corporation Limited (BPCL)Bharat Petroleum Corporation Limited (BPCL) is an Indian public sector undertaking engaged in refining crude oil and marketing petroleum products.
As of July 8, 2025, BPCL's stock price is Rs 357.25, up 1.93% for the day, with a 19% gain over the past year, outperforming the NIFTY (4.25%) and Nifty Energy index (14.32%). It has risen 11.5% in the last month.
From September 04,2024 to Feb 28, 2025- the stock saw a continued decline, Stock price fell from 378 to 234. But after that, within 2 months from April to May , the stock gave sixty percent(60%) return. And remained range bound for some days. then suddenly started running away from mid-June2025.
This is about those days when people showed interest in other nearby stocks apart from the defense sector. You will see that for the last few days, there is a boom in gas and petroleum sector. The thing to understand is that this is a good resistance of 380. And if it does CROSS 380 then it will definitely go up to 420. Remember one thingPSU company shares good profit through dividend.If you find it below again, 301 is good support.
Someone has said that only God and a liar can tell the stock target. No problem, we will continue our training and trade with trailing stop loss (10EMA).

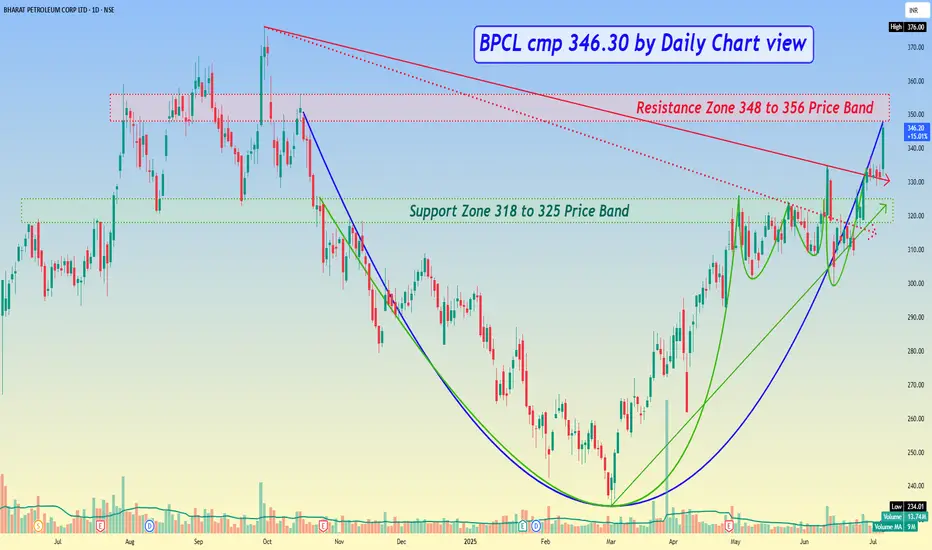
BPCL cmp 346.30 by Daily Chart viewBPCL cmp 346.30 by Daily Chart view
- Support Zone 318 to 325 Price Band
- Resistance Zone 348 to 356 Price Band
- Strong Bullish Technical Chart Setup indicative of good upside once price crossover and sustains closure above Resistance Zone
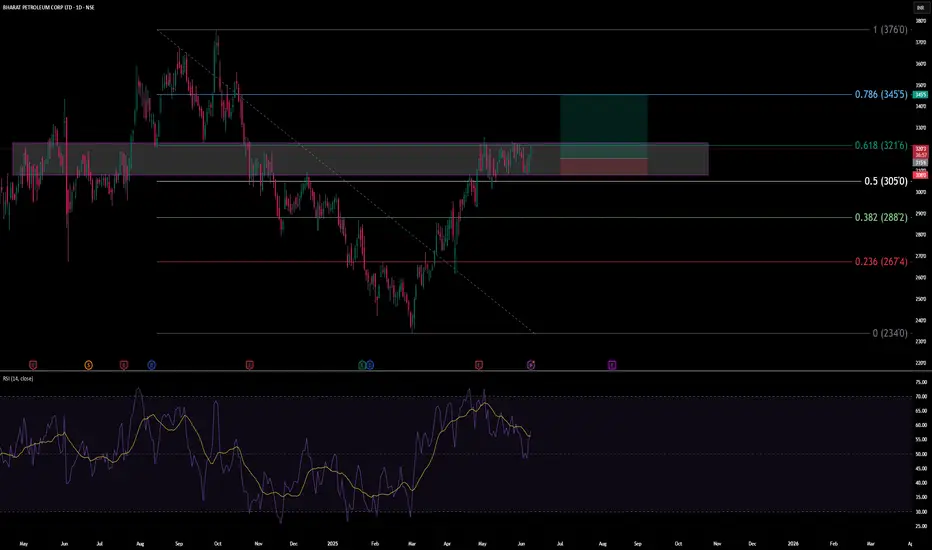
BPCL Gains Momentum After Key Support, Faces Resistance AheadTopic Statement:
BPCL has made a strong upward move in the recent rally, though key resistance levels and chart patterns suggest caution.
Key Points:
* A head and shoulders candlestick pattern is visible, indicating potential reversal signals to watch
* The stock took heavy support at the 50% Fibonacci retracement level, where it also briefly dipped below the 180-day EMA
* Price is currently facing resistance at the 23.6% Fibonacci level near 317, which may act as a short-term cap on further gains

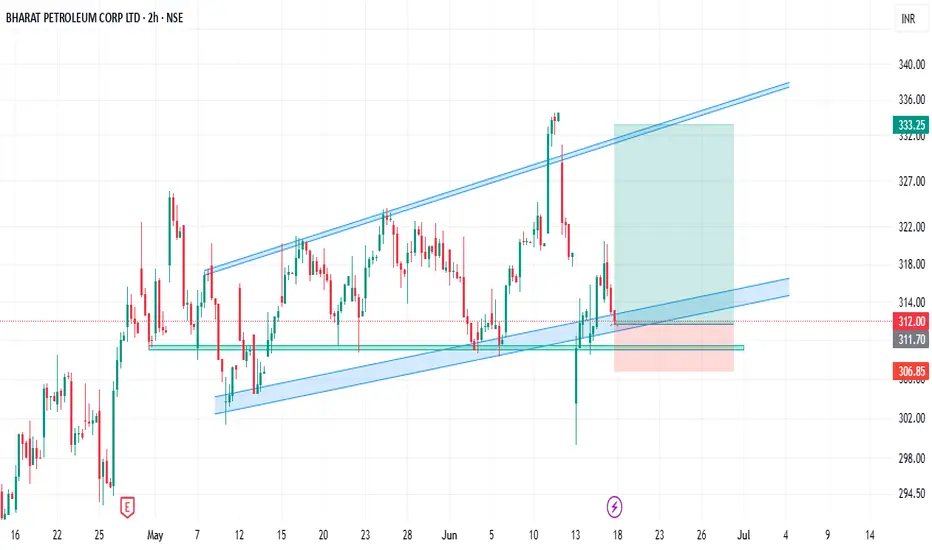
BPCL: Price Testing Channel Support – Long Setup in PlayHello fellow traders! Hope you’re all doing well.
Bharat Petroleum Corp Ltd (NSE: BPCL) is currently offering an interesting price action setup on the 2-hour chart.
The stock has been trading within a well-defined ascending channel, respecting both upper resistance and lower support over the past several weeks.
Recent Price Action Highlights:
1. After facing resistance near ₹333, BPCL has pulled back to the lower boundary of the channel.
2. Price is now consolidating just above the channel support and a prior horizontal support zone.
3. A long position seems to be in play, as visible from the Risk:Reward box on the chart.
Setup Details:
Entry Zone: Around ₹312 (current price)
Stop-loss: Below ₹307 (Closing Basis)
Target: ₹333+ (near channel resistance)
Disclaimer:
This is a personal analysis and not financial advice. Please do your own research and trade responsibly. Risk management is key.
Thanks for reading!
Looking forward to your thoughts and feedback.
Best regards,
Anantesh
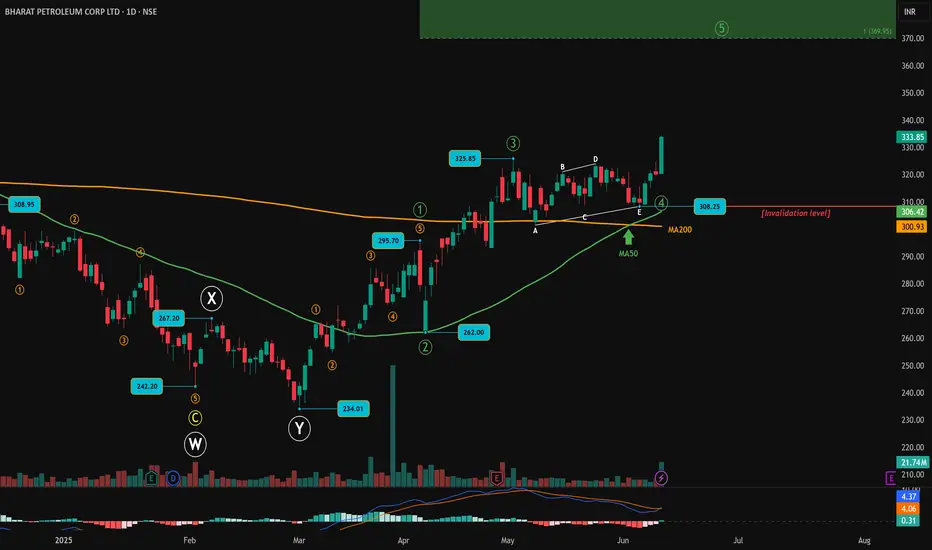
BPCL Breaks Out of Triangle: Wave 5 Takes the WheelBharat Petroleum (BPCL) appears to have completed a correction phase and is now showing signs of beginning its final leg higher. The entire corrective structure ended at ₹234.01. From there, a clear five-wave impulsive rally began, marking the beginning of Wave 1 of a new trend. After a brief correction as Wave 2, the stock surged again to ₹325.85, completing Wave 3. What followed was a contracting triangle, unfolding as an A-B-C-D-E pattern—suggesting a typical Wave 4 consolidation.
The breakout from this triangle came with a strong bullish candle, supported by a spike in volume. Price has now convincingly moved above both the 50-day and 200-day moving averages, with the 200-day MA serving as a platform for the triangle structure itself. This alignment of price, structure, and moving averages supports the hypothesis that Wave 5 has just begun.
MACD has triggered a fresh bullish crossover, adding confirmation to the momentum buildup seen after the triangle breakout. The structure remains valid as long as the price holds above ₹308.25, which marks the end of Wave 4 and serves as the key support level. Additionally, the 50-day moving average (MA50) sits just below, offering another layer of dynamic support. A sustained hold above these zones keeps the bullish bias intact and supports the ongoing development of Wave 5.
Wave 5 targets lie near ₹369.95, which is the 1.0 extension of the Wave 1 length projected from the Wave 4 low. Any pullback toward the breakout zone near ₹308–₹315 could offer a low-risk entry opportunity as long as the structure remains valid.
Chart will be updated as price action evolves.
Disclaimer: This analysis is for educational purposes only and does not constitute investment advice. Please do your own research (DYOR) before making any trading decisions.
BPCL | Ferocious Flag - Looks good for 30%BPCL | Ferocious Flag 🏁
Looks good for 30% based on the flag setup
Keep SL below 300 for short term trading position
CMP : 334

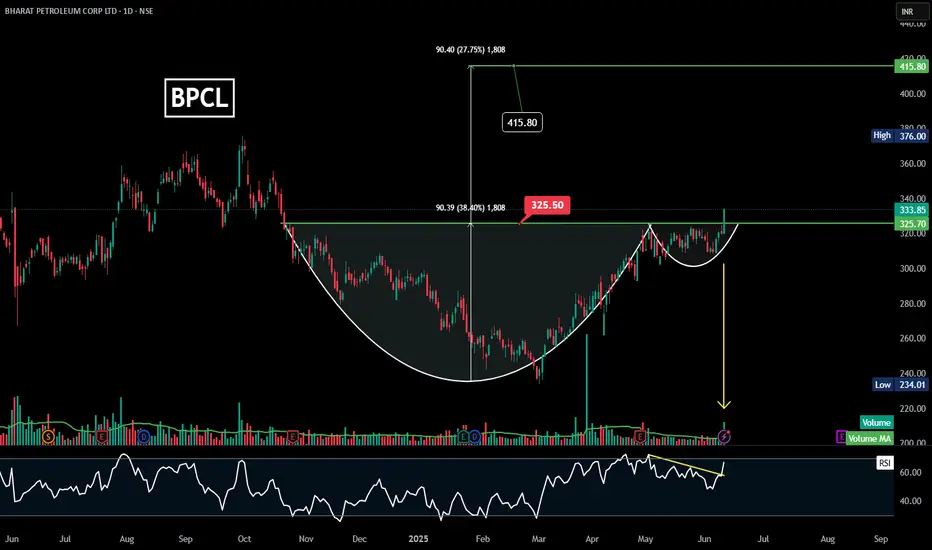
BPCL | Cup and Handle | Breakout |Daily
### 🏺 **Pattern Overview:**
✅ **Cup and Handle Formation:**
* **Cup period:** November 2024 – June 2025.
* **Handle period:** Short, forming in May 2025 – breakout seen recently.
✅ **Breakout Confirmation:**
* **Breakout point:** ₹325.50 (previous resistance).
* **Current breakout price:** ₹333.85 with strong momentum.
---
### 🎯 **Target Levels:**
* **Measured move target:** ₹415.80 (as marked).
* **Near-term resistance:** ₹376 (prior swing high).
* **Support:** ₹325– (previous breakout level).
---
### 📊 **Volume & RSI Insights:**
* **Volume:** Surge on breakout day – confirms buyer interest.
* **RSI:** Clear bullish breakout above a downward-sloping trendline (marked in yellow arrow).
---
### 💡 **Takeaway:**
BPCL has **confirmed a cup and handle breakout** above ₹325. If it sustains above this level, a move towards ₹376–₹415+ is probable in the coming weeks.
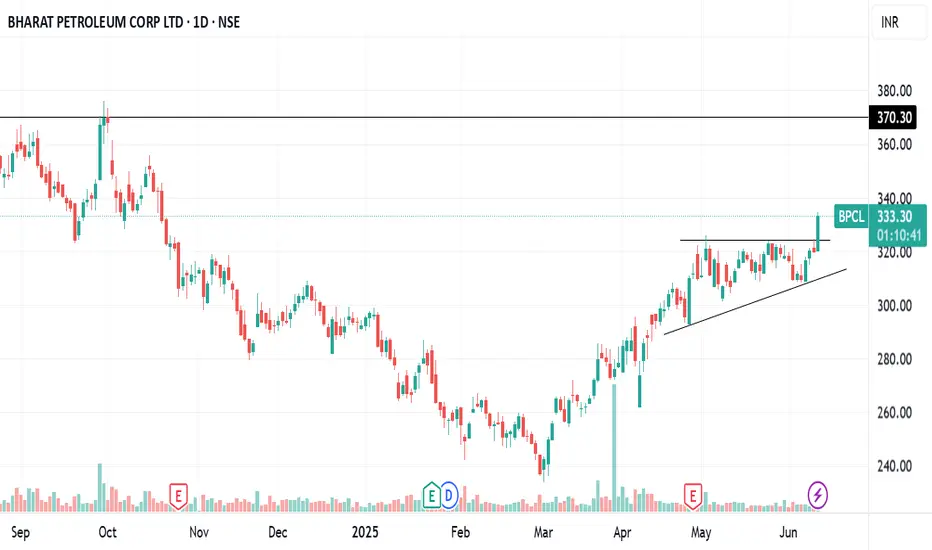
BPCL ASCENDING TRIANGLE BREAKOUTBPCL breaking ascending triangle pattern
bullish RSI ,huge volume
macd crossover done
#target 370
NO BUY/SELL RECOMENDATION
BPCl is working on a rise after a short consolidation.This is a Paper Trade Idea on BPCL.
After the recent correction it has managed to go above 0/5 fib retraction and taking the next levels.
here is a quick trading idea with given stoploss and targets.
let me know your thoughts.