Market insights


Monday BPCL Perfect Entry Opportunity 1:10 Risk RewardCreating Higher high and higher lows and at support creating double knockdown strategy
Entry above 450
SL 440
R1 465
TG1 494
TG2 508
TG3 549

BPCL is looking great for short to medium term bet.#BPCL is looking great for the short to medium term bet.
1. Broker long term resistance range.
2. Hepty divedend of INR 58 around the corner.
3. Potential buyers are alread showing interest.

BPCL triangle pattern breakoutBPCL breaking the ascending triangle pattern for an upmove towards 550. Dividend will also boost up buying atleast till the record date.
Stock closing below trendline may show bearish nature. FYI only.

bpcl near to weekly triangle pattern break out/downkeep an eye on bpcl weekly chart which is going to break its triangle pattern in nearby term

BPCL Bouncing off from Trendline BPCL is bouncing off from its 1.5 year long trend line. It has bounced off from this trend line every time since Mar'2020 fall, thus forming and re-forming the support. Also, Daily chart is exhibiting RSI divergence as well.
We are bullish on this stock with 480 resistance zone as target.

BPCL PRICE ACTION ANALYSIS. PRICE TARGETSBPCL is trying to break the resistance at 481, which has not been sustained since last year. If BPCL manages to stay above 481, then we can see momentum to the upside.
Go long above 481 and place a stop loss below 440. This is a monthly timeframe analysis, so we can provide some time for the price to adjust in case of a fall. Add more quantity when the price comes to test the trendline on the chart.
The targets are given by the XABCD bearish butterfly pattern. This is a very good risk-reward trade setup.
Happy trading :)
This is just for educational purposes.

BPCL about to give breakoutWe may see a breakout in BPCL tomorrow. A sharp move is expected from here.


HORIZONTAL & TRENDLINE BREAKOUT FOR BPCLBPCL looks strong above 480.
a weekly horizontal resistance at 480 needs to break with strong volume for entry confirmation.

BPCL for long entryKeep an eye on BPCL, if able to BO the resistance area above 472 then we can go long . Stock forming HH on the charts. Entry only after the BO of the area.

BPCL Chart patternOnly Education purpose Bpcl follow rounding pattern and ready for breakout triangle pattern

BPCL - buy on dipsBuy < 467 upto 464
easy target 480
tg2 - 488
Disclaimer : This is my personal analysis for study purpose not intended for trading


BPCL Swing IdeaWe can expect 490 & more..in coming days
It has broken out of the supply zone and has also retested the zone.
Hence, we can expect more in this..on long side.

BPCL intraday setup 15m charthello traders
this is just a idea
i am not a financial advisor
thank you

[POSITIONAL] BPCL LONG BET risk: Reward ratio is 1: 2
Rest as per Charts
********
Note -
One of the best forms of Price Action is to not try to predict at all. Instead of that, ACT on the price. So, this chart tells “where” to act in “what direction. Unless it triggers, like, let’s say the candle doesn’t break the level which says “Buy/Sell if it breaks”, You should not buy/sell at all.
=======
I use shorthands for my trades.
“Positional” - means You can carry these positions and I do not see sharp volatility ahead.
“Intraday” -means You must close this position at any cost by the end of the day.
=======
Always follow a stop loss.
In the case of Intraday trades, it is mostly the “Low/High of the Candle”.
In the case of Positional trades, it is mostly the previous swings
********


BPCL LOOKING STRONG Company has reduced debt.
Stock is providing a good dividend yield of 9.34%.
Company has been maintaining a healthy dividend payout of 85.47%
TIME TO ENTER BPCL FOR SWING Company has reduced debt.
Stock is providing a good dividend yield of 9.43%.
Company has been maintaining a healthy dividend payout of 85.47%
Market Cap
₹ 101,250 Cr.
Stock P/E
8.73
Book Value
₹ 247
Dividend Yield
9.43 %
ROCE
18.6 %
ROE
27.3 %
Face Value
₹ 10.0


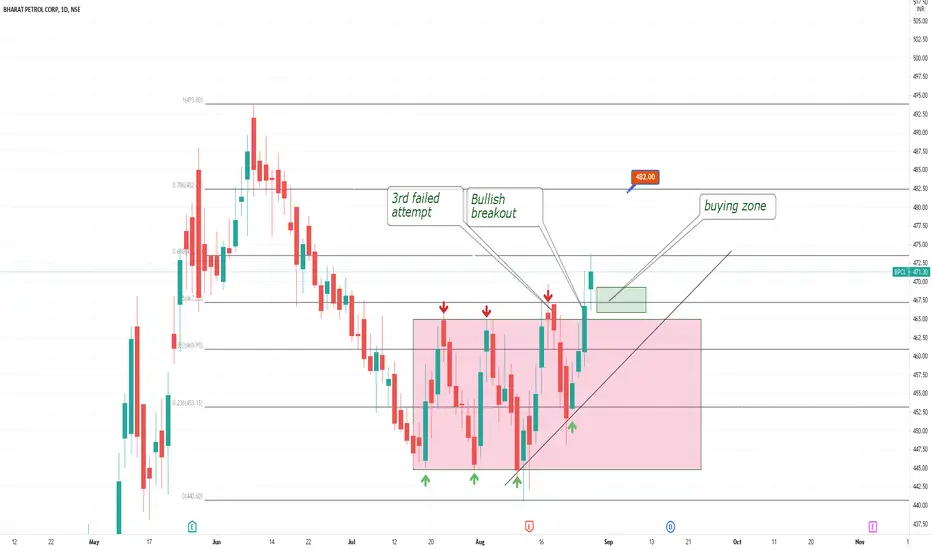
Simple Trade Setup | BPCL | 27-08-2021NSE:BPCL
Observations:
1) On Daily Time frame Yesterday it broke 50DMA and today it took support from 50DMA.
Please refer chart below : daily time frame.
2) On Daily Time frame: Also it breakout the range today.
Please refer chart below : daily time frame.
-------------------------------------
Trade Setup for Date 27-08-2021:
1) Don't Jump in to trade at the beginning of the market. Let it get settle for 15-20min first and judge the price action.
2) Everything is mentioned on the chart. I hope it is easy to understand.
3) All the levels will work as support, resistance, entry and exit w.r.t price action near that level tommorrow.
Please refer below chart for levels.
Hope I made it easy to understand it.
Do comment your doubt or suggestion.
