COROMANDEL may breakoutThere was a good shakeout in this stock and now it is at an important resistance level. I am ready to buy if it breakouts. Stop loss will be below the breakout candle.
COROMANDEL trade ideas

Medium term opportunity in Coromandel for >20% upsideHi,
NSE:COROMANDEL has given a Bullish Flag Breakout on Weekly charts with very good volume.
MACD is also on the bullish side on Weekly time frames. RSI is also on the bullish side on daily, weekly and monthly time frames.
In the current market scenario, I am expecting that the bullish momentum will continue.
Complete price projection like entry, stop loss and targets mentioned on the charts for educational purpose.
Don't Forget to Follow me to get all the updates.
Please share your feedback or any queries on the study.
Disclaimer: Please consult your financial advisor before making any investment decision.

COROMANDEL INTERNTL#COROMANDEL
Watchlist Alert..
Closing Abv 1780 will give some momentum ..
Can Keep it in watchlist.

coromandel intl- again for upmove?sector strength, plus good accumalation base and now breaking off to take the shot up

GOOD LEVEL TO BUY good level to buy tp sl on chart price came at a discount zone from premium zone at to take action

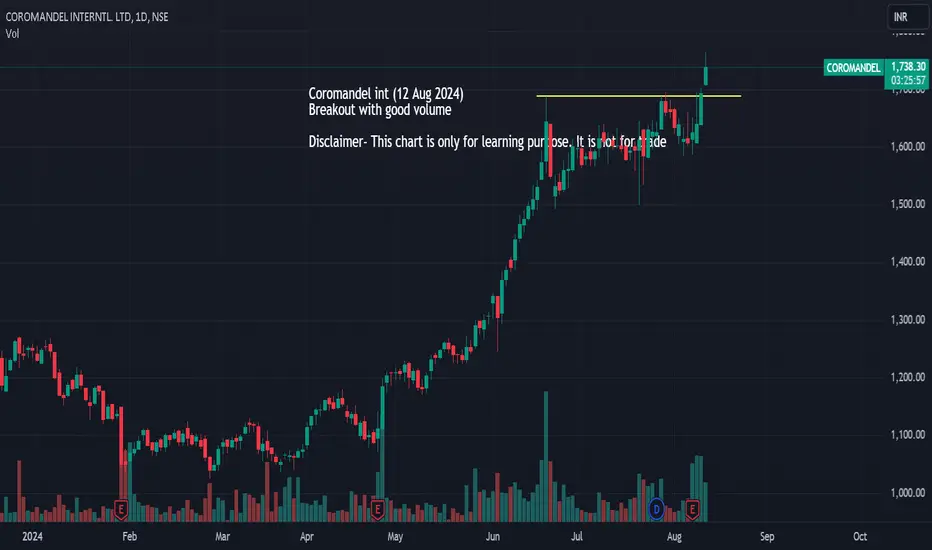
Coromandel int (12 Aug 2024)Coromandel int (12 Aug 2024)
Breakout with good volume
Disclaimer- This chart is only for learning purpose. It is not for trade.
CoromendalBased on price moving and Ema
positions Up move possibility is higher
This is only for educational purposes.

CoromendalBased on price moving and Ema
positions Up move possibility is higher
This is only for educational purposes.

Coromandel International - Breakout Setup, Move is ON...#COROMANDEL trading above Resistance of 1456
Next Resistance is at 1680
Support is at 1239.80
Here is previous chart:
Chart is self explanatory. Levels of breakout, possible up-moves (where stock may find resistances) and support (close below which, setup will be invalidated) are clearly defined.
Disclaimer: This is for demonstration and educational purpose only. This is not buying or selling recommendations. I am not SEBI registered. Please consult your financial advisor before taking any trade.

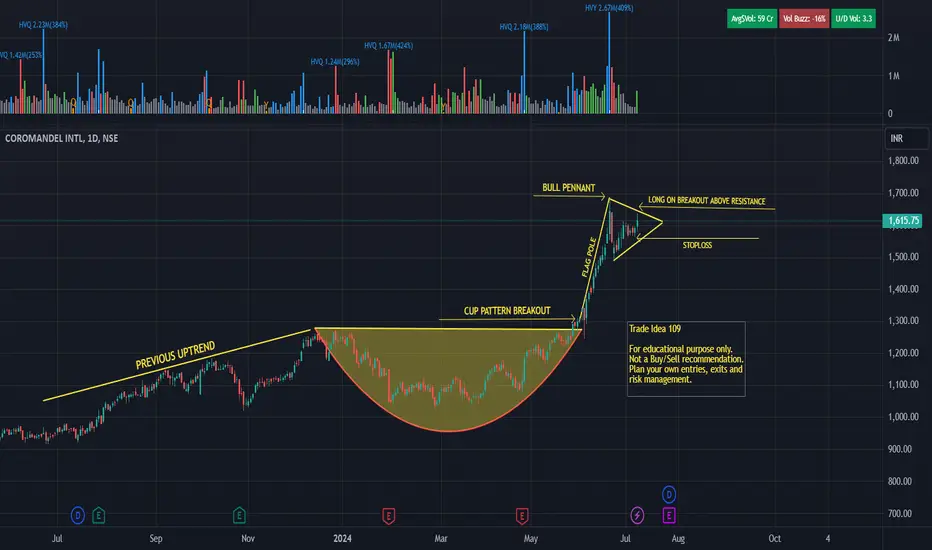
Coromandel - Bull pennant continuation patternCoromandel International - NSE
Higher Trade and Delivery Quantity.
Close crossing Lase Week High.
Outperforming Stock.
Disclaimer:
For educational purpose only.
Please do your own research before taking any trades.
Happy Trading!
Long trade - Coromandel consolidation breakout in daily chartTrade Setup - Pole and Flag pattern breakout in daily charts. RSI is bouncing from 60 indicating strong momentum, Bullish engulfing pattern with good volume, price has broken out of the Bollinger bands squeeze
Targets - Blue sky zone
Execution - Enter above the high of 29th Jul candle, stop loss below the low of the same

Bullish Price Action in Coromandel: A Long Opportunity?The one-day time frame chart of Coromandel International stock is looking gold due to strong price action. After a breakout, the stock started an upward move, forming higher highs and higher lows twice, which indicates a solid bullish price action. Recently, the stock traded at an all-time high of Rs. 1273.95, followed by some profit booking. If the price follows the trend line and reaches it again, it presents a good entry point for a long position with a target of Rs. 1350 to Rs. 1400.
NSE:COROMANDEL

COROMANDEL 30-05-2024Happy learning with trading. I just shared my view. If correct give me one like. If not correct me.
Points to Note:
1) support from bounce and looking for breakout with good volume
2) Chart looks good and we can see ATH.
Disclaimer:
I am not a Registered Analyst with SEBI and it is only for educational purposes. Please consult your financial advisor before making any decision. I will not be responsible for any of your profits or losses.

THE BOWL PATTERN. Clean and simple once the stock breaks out.THE BOWL PATTERN. Clean and simple, this sleeper pattern takes off once the stock breaks out.
For the 2005 winners, the breakouts occurred on 52-week highs of the stocks' prices. In his book Encyclopedia Of Chart Patterns, Thomas Bulkowski tested and rated the various patterns, and the rounded, or bowl, pattern was the second most likely to rise, with a 54% chance to rise 20% or more. Even if a stock isn't the next big winner, it's a big bonus if you have a better than average chance of making money on the trade.
Beyond the breakout pattern, logically the top 10 stocks should have strong fundamentals and it's important to know exactly what made them go up. So in retrospect, I followed the trail of news releases and earnings reports fueling their growth.

#COROMANDEL #NSE - CUP PATTERNCOROMANDEL INTERNATIONAL LTD
Completed CUP pattern in daily timeframe.
Breakout of resistance line.
Disclaimer:
For educational purpose only.
Please do your own research before taking any trades.
Happy Trading!

Coromandel Intl (NSE) - Potential Breakout and Uptrend ContinuatCoromandel Intl (NSE) has been on an upward trend for the past few months, with higher highs and higher lows. Recently, the price appears to have broken above a resistance level around ₹1,271.69, which could signal a continuation of the uptrend. Additionally, the trading volume on the day the chart was published was slightly above average, indicating potential increased buying pressure.
Bias: Bullish
Analysis:
Upward trend: The chart displays a clear upward trend with consistent higher highs and higher lows.
Breakout: The price seems to have broken above a resistance level at ₹1,271.69, potentially indicating a continuation of the uptrend.
Considerations:
Short-term pullback: The price has pulled back slightly from its recent high. This could be a buying opportunity, but it's also important to be aware that it might signal a temporary loss of momentum in the uptrend.
Missing indicators: This analysis is based solely on price action. Using technical indicators could help confirm the strength of the trend and identify potential support and resistance levels.
Conclusion:
Coromandel Intl (NSE) presents a potential opportunity for a continuation of the uptrend based on the recent breakout and overall price movement. However, a short-term pullback is also a possibility. Further research and the use of technical indicators are recommended before making any investment decisions.
Category: Analysis
Investment Strategy: Bullish
Tags: NSE, Coromandel Intl, Uptrend, Breakout
Disclaimer: This is not financial advice. Please do your own research before making any investment decisions.

CoromendalThis stock up move as per the below prediction
1.21 Ema above 50 Ema
2.50 Ema above 200 Ema
3.Price above 21 EMA
4.21 Ema retrace
5.Stock in unmoved
5.ROCE >15
6.Debt to equity<1
This is for the educational purposes

Coromandel International all time highCoromandel int is all time high and near resistance and RSI (dwm) 70, 67 & 66

CoromendalThis stock up move as per the below prediction
1.21 Ema above 50 Ema
2.50 Ema above 200 Ema
3.Price above 21 EMA
4.21 Ema retrace
5.Stock in unmoved
5.ROCE >15
6.Debt to equity<1
This is for the educational purposes

COROMONDEL INTERNATIONAL Looking good at CMP Can add more on deep. Moving in channel. If breakout happen then it will fly.


Coromandel bullish Tgt 1300-1360-1450 28/04/24Coromandel International Ltd. is another interesting stock
1. price rise with huge volume
2. major Support 1100 to 1125 zone
lets see how it evolves
Disclaimer: I am not an expert I just share interesting charts here for educational purpose and not to be taken as buy/sell recommendation. Please seek expert opinion before investing and trading as trading/ investing in market is subject to market risks. I do not hold any position in the stock as on date but I may look to buy on dips with my own Risk Reward matrix.

COROMANDEL - Bullish Swing Reversal with VolumesNSE: COROMANDEL is closing with a bullish swing reversal candle supported with volumes.
Today's volumes and candlestick formation indicates strong demand and stock should move to previous swing highs in the coming days.
The stock has been moving along the horizontal support for the past few days which is indicating demand.
One can look for a 11% to 18% gain on deployed capital in this swing trade.
The view is to be discarded in the event of the stock breaking previous swing low.
#NSEindia #Trading #StockMarketindia #Tradingview #SwingTrade
