CYIENT RISK REWARD 1:2BUY CMP
SL-1174
TGT- 1333
TAKE MIN RISK REWARD 1:2
Disclaimer: This is for demonstration and educational purpose only. This is not buying or selling recommendations. I am not SEBI registered. Please consult your financial advisor before taking any trade.
CYIENT trade ideas

Cyient Long SetupStock is trading near long term trendline which has been working as a support, price is seeing a bounce from the trendline. Stochastic has also reversed from the 20 level. RSI is also supporting the trendline currently above 50. From here on we can see the price reaching to recent swing high. Setup will be invalidated if price drops below 1025.

Momentum buy # CYIENT# Trendline Support at 1055 keep watch this level for buying with SL 976 for a short term target of Rs.1500++

CYIENT - Bullish TrendNSE:CYIENT
CYIENT is in a bullish uptrend and expect to follow the trend
Target - 1250
T2 - 1300
Stop Loss - 1070
Disclaimer - Its not a Recommendation. Please share your comments

Cyient AnalysisConsistent Returns after the 2020 Crash. Results were not impressive hence there is a slow movement in the stock.
Huge support at 967, Support 1083 right now the stock gave a breakout above its resistance for 2 days.
RSI & MACD are nearing Overbought zone might see a pullback sooner. Can enter now (Dividends on 26/10, it may boost the price for few days) and add more at pull back or wait and enter, for short-mid term trade, the perfect buy levels were 1050-1100.
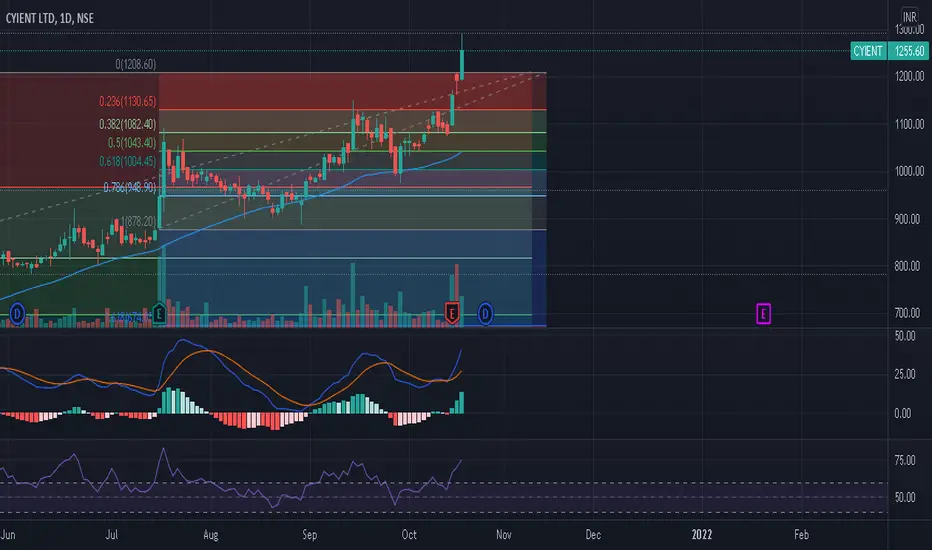
Earnings Break - Impulse & Trend AnalysisIt is clear that the share price of CYIENT increases in the band of 10-20% based on Earnings Calls.
This Quarter, we have already seen the positive earnings report from Infosys, Wipro and Mindtree yesterday i.e. 13th October.
CYIENT is expected to release its earnings today i.e. 14th October
Considering the strong performance by the company in recent 4 quarters and the in general positive outlook from IT sector, it will be interesting to see if CYIENT can repeat this impulse wave this earnings report or will we see an anomaly this time. The targets can be inferred from the Fib lines drawn.


Cyient - Cup and HandleAll trade ideas provided are the opinions of the publisher and should not in any way be considered as financial advice. Please do your own research and consult your advisor before investing in stock markets.

CYENT : ROCKETEntry @CMP
TGT - 1250
𝑫𝒊𝒔𝒄𝒍𝒂𝒊𝒎𝒆𝒓:
The analysis is only for illustration purposes only. Please consult your financial advisor, agent, broker before acting on any information. We may or may not have positions in the stock and our actions may be contrary to the one mentioned here. This analysis may or may not be updated. We would not be responsible for the profit/loss resulting from this analysis

NSE:CYIENT BuyNSE:CYIENT
#CYIENT Formed Cup & Handle pattern and Broken the Resistance level with good volume, Sustainability above level will give good momentum.
Levels Perfectly captured & shared for FREE Everyday !!
Levels shared yesterday and results...
#MINDTREE - 16%
#IRCTC - 12%
#WIPRO - 11%
#VEDL - 8%
#GRASIM - 7%
All these stock levels shared and almost all got blasted results, check the other stocks shared and how it got resulted.
Have a Happy trading.
If you like the analysis, Hit like button and share it with your friends to extend your Support.

Trend Analysis - Bounce from SupportOur last move on Cyient was very successful and we were able to catch a 15% price increase.
This time around, similair set up is there. Bounce from Trend Support, MACD cross due, and EMA 9,21 looking positive. RSI is positioned perfectly too.
Expecting some upside movement here.

Cup and handle BOStock is trading above the pivot point and close to first resistance, enter above 1129 for targets of 1169 and 1235 with a stop loss of 1065

CYIENT LTD
Target:- 1400
Stop Loss:- 983
Duration:- 7 to 8 Weeks
The stock has already touch the support line and showing a bullish candle, which is an indication of upside move, so we can buy this at market order. This is basically parallel channel. Use proper stop loss and maintain discipline throughout the trading period and use trailing stop below all the wave.

Cyient Daily ChartRecent Multiyear Breakout, Looking Bullish With Volume
Retested Multiyear Breakout Level
Good Entry at Current Level
Weakness Below 1000
Sector: IT
Great Fundamentals
This Post Is For Only Study Purpose
I'm Not A SEBI Registered


2 reasons to buy || Cyient1)Bounce from uptrend support
2) Good volumes
Can be bought for a target of 1060. CMP-977 and SL will be 905 on a closing company. SL is kept a bit far because of good fundamentals.

Target achieved ! 8.5% gain!!The stock was given at 977 on 1st Sept and today it hit the target of 1060. An easy 8.5% gain. HIT the like button if you liked my analysis and do FOLLOW for more swing trading ideas. For reference, I am attaching the idea suggested below.

CyientCyient
White Marbozu Candle Spotted in todays chart
Stock moved almost 4% today in intraday
Any upmove above 1090 can give breakout in the stock

Cyient Ltd showing signs of reversalCyient Ltd showing strong signs of reversal
Given breakout of falling trendline
Taken support from the strong base zone
RSI showing positive strength
DISCLAIMER
( Educational Purpose )
All investments involve risk.
Please Do your analysis before initiating Any trade
Good luck !

Identifying Set Ups - Price Action + MACD + EMAToggling between numerous stocks can be tiresome. Using a strategic method to identify potential set ups can save your time and deliver amazing results!
In the above chart,
I first noticed that the price was around its support. It can be confirmed by seeing the previous price swings that the support is well tested.
Next I look at the MACD to confirm if the divergence between the Signal Line and MACD line is decreasing to make sure if it is the right time to enter or not.
Usually these 2 steps take hardly a few seconds and I can form a preliminary idea about the position.
Once these two points are confirmed,
I move forward to confirm if the EMA 9,21 (which can been seen has worked out beautifully for this stock in the short time frames like 7-10 days) is actually looking bullish to enter right now. If the EMA is not already crossed, or about to cross, I can drop the share here. In this case, the EMA lines are very close and the chances of a bullish cross are good enough.
Next, I confirm my hunch by looking at the Volume data and see if the increase is price will actually be sustained by smart money flow, or fall down by retail trading pressures. Increasing volume with price increase helps to get conviction for a long position.
Finally, I check the RSI levels and I monitor them very closely to see if there is any Bullish or Hiden divergence and see how strong they might be. I also like to draw a vertical line at the key level from which RSI always bounces or retracts. Personally I prefer RSI levels between 50 and 60, after a recovery from 30-40. It just implies that the bulls are gaining control again and still leaves out plenty of room for entering a trade and making profits before it hits the overbought region.
After I am satisfied with the Technicals, the last thing remains is to check if there are any major news, events or rumours about the share and the recent EPS growth of the share. This doesnt affect a lot in the short run, but doing due diligence never hurts. It is how I identified IEX, HUL and TCS just right before they shot up.
Thanks for reading!
Keep Learning :)

Trade with Conviction - Price Action + MACD + EMAIn the chart above, we can see that the trend resistance and support lines are well established, from where prices have bounced and retreated from on multiple occasions.
After a decent recent pullback, we find the Exponential Moving Averages looking up again, almost ready for a Bull Cross.
I personally prefer 9,21 Days EMI for trading in a short time frame of 7-10 days. It can be easily seen that on numerous attempts, price has kept these EMA levels.
MACD and RSI play an important role to confirm the hunch from the preliminary screening off the Support & Resistance and EMA lines.
I try to watch out for where the RSI levels are moving toward and the key levels from where it bounces. Personally I find the 50-60 region safer, after rising from a lower level, as it not just implies that bulls are back in control, but it also leaves decent room for upside movement and gain from the share.
MACD helps to now time this entry right. If its clear that the divergence levels are reducing and the lines are closing in for a Bull Cross, I can form a decent opinion if I want to wait for the cross or enter while the divergence is still decreasing. Most of the time, I enter right before it is all set for a Bull cross. It helps me to get an early entry and close my position in a day or two if the MACD cross is rejected, this keeps the losses to a minimum.
Finally, Volume surge serves to further strengthen the view that the increase in price is accompanied by smart money flowing in, and now you know that this price increase will have a sustained increase with momentum. EPS and Financial position of the company seem good, and that checks out all the major points for a long position.
To summarise, watch out for EMA and Resistance Support levels to screen stocks preiminarily. Out of the selected bunch, review the RSI and MACD levels. Increasing Volume with Price increase always helps. Check the EPS growth at least, and set the targets and stop losses as per your risk appetite.
Thanks for reading :)
