DABUR 1DDisclaimer :-
*For educational purpose only it's not a call do your own analysis.
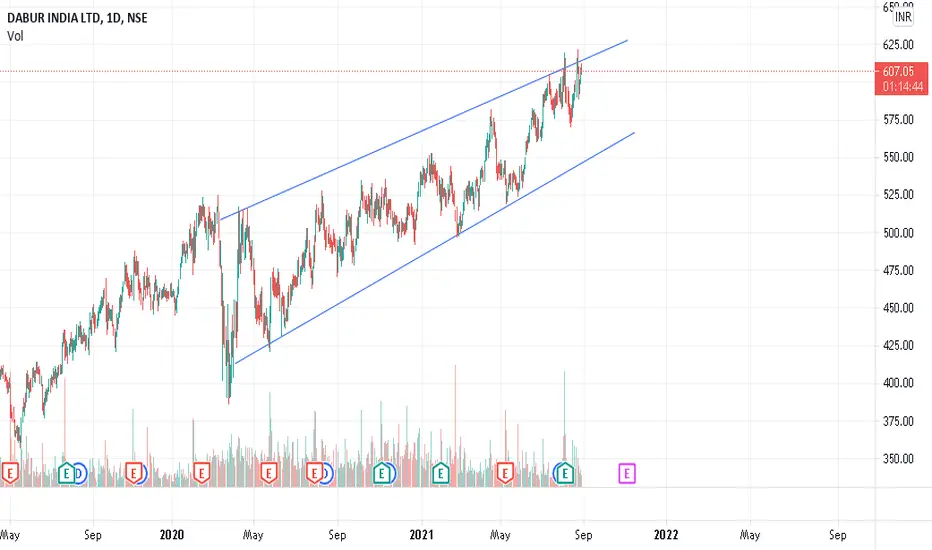
Stock has given Breakout of channel pattern retest has done & trading above all moving averages. Bullish hammer has formed.
Thanks!
#Breakouttrades.....
DABUR trade ideas

Simple Trade Setup | DABUR | 08-09-2021NSE:DABUR
Observations:
1)On daily time frame, it made shooting star candle. This is kind of a bearish suggestion that it will start bearish trend now. But only if it trades below today's low. Which is 635.40 so we can consider 635 level.
If it fails to hold 635 level tomorrow and breakdown and trade below 635 then we can see bearish move tomorrow in DABUR.
Please refer below chart : Daily time frame.
-------------------------------------
Trade Setup for Date 08-09-2021:
1) Don't Jump in to trade at the beginning of the market. Let it get settle for 15-20min first and judge the price action.
2) Everything is mentioned on the chart. I hope it is easy to understand.
3) All the levels will work as support, resistance, entry and exit w.r.t price action near that level.
Please refer below chart for levels.
Hope I made it easy to understand it.
Do comment your doubt or suggestion.

DABUR intraday analysis and setup🎇Hello Traders👋
Today i have made a post on DABUR 15m
I hope you find this post helpful and informative👍
The targets and stoploss would be given in the charts or they would be according to pivot points
Thank You
—DISCLAIMER—
I am not a SEBI registered financial advisor
Please consider your consultant's advise a must , all the setups posted here will be considered as informative and helpful post
I shall not be responsible for your profits and losses

DABUR INDIA LTDDABUR INDIA formed a triple top. We can go long after breaking top and go short below the levels 625.
*For educational purpose only


Dabur - Inverted Head and Shoulder BreakoutIf Dabur gives closing above Rs. 644 with a strong 15m candle, an intraday long trade can be taken as it is also forming an Inverted Head and Shoulder Pattern on 15m candle chart. I have also drawn recent support and resistance trend lines. 1% Target can be easily taken if it goes bullish tomorrow or you can also refer to Pivot Points for the target.
Please let me know your suggestions as well.
Thanks & Regards
Hritik Kaushik

DABUR INDIA LTD (swing)NIFTY FMGC GAVE A GOOD MOVE THIS WEEK, Dabur india broke a long channel pattern looks good for a positional trade , entry 641, stop loss 582, first target 731

DABUR: BULLISH TRIANGLEDABUR: BULLISH TRIANGLE
_______
Buy CMP: 596.7
Target: 639.15
StopLoss: 574.00
This is my personal view about DABUR. Take it for an educational purpose. I am not Sebi registered or any Stock market expert. I am not responsible for profit or loss.

DABUR INDIA DOUBLE TOP 15 MINDABUR INDIA formed a double top. We can go long after breaking double top and go short below the levels marked.


Dabur India: Pole and Flag BO and retestStock has given a pole and flag BO and has now retested the previous resistance.
Now this resistance should work as support and stock should bounce back from here for a target of 625-640.
SL can be placed at around 550 level on Daily closing basis.
DISC: For educational purposes only.

Dabur Breakout Zone....As we Can See Dabur it at its previous Resistance Zone And Trying to Give breakout
if on coming sessions we see any Momntume above 618 then we can go long as of now FMCG sector is also strong
Buy Above 618.60
Target - 622/625
SL - Below Trendline Or Own SL
I think tommorow FMCG sector will lead ...Cause its chart patterns showing Strentgh..
But Market Is Supreme So Cant Predict What Will Happen ....

DABUR 1D*For educational purpose only, it's not a call. Do your own analysis.
Keep watching DABUR for coming days.
Thanks.


DABUR looking up and aboutDABUR giant has been consolidating in the channel since March this year and likely going to give a breakout on the up side. Once it crosses over and give a good volume on breakout, we can expect a movement of 80 to 100 pips upwards due to height of channel.
WHAT WOULD BE DABUR UPCOMING MOVE?We tried to predict the upcoming move for Dabur India, it may go to retest the highs of the wedge and come down to the lower yellow line.
We would try to update the idea and let's see how it unfolds.
To motivate me, Please like the idea If you agree with the analysis.
Happy Trading!
InvestPro India Team

DABUR HOURLY ANALYSIShello traders
today i have done dabur analysis on basis of supply and demand and chart patterns
the demand is fresh and we can expect it to reach its supply
but if this fails the reason will be volume, the volume is very less and decreasing which is very bad
pls feel free to ask anything and correct me
happy trading to you.

DABUR - Price and Trend SetupDABUR is gaining strength as compared to Nifty50 Index. Key support levels are highlighted, stock can test levels soon.


Dabur Ltd - ShortHi Friends,
Refer to the Dabur, the Script has now reached the channel Top now the script can reverse to the support level.
Trend are in the Bullish Side. But Price Action evidence the script was in the parallel channel top which was in the range bound.
We are going against the trend based on the below facts:
1. Volatility of the script was in the peak
2. Stochastic RSI was in the overbought range at 2hr, Day and Weekly TF
3. CPR Resistance 1 was reached.
4. Channel Top was reached with confluence on Resistance line.
5. Script was in the Range Bound.
6. EMA 50 was far away from the value which was confluence to Stochastic RSI.
Entry: Tomorrow Open
SL - 622+13.50 - 635.50to 636 ( 1ATR Above 23rd August High)
Target - 574-571.

BUY ABOVE 586 SL 573 TG 612BUY ABOVE 586 SL 573 TG 612...There is a bullish candle formed near support. It's a high probability long trade on DABUR

Dabur*for educational purpose only.
Stock is looking good above 620.
Safe buying above previous high.

daburcan break its all time high keep on radar volumes are supportive it can give a slight pullback so keep in watchlist
