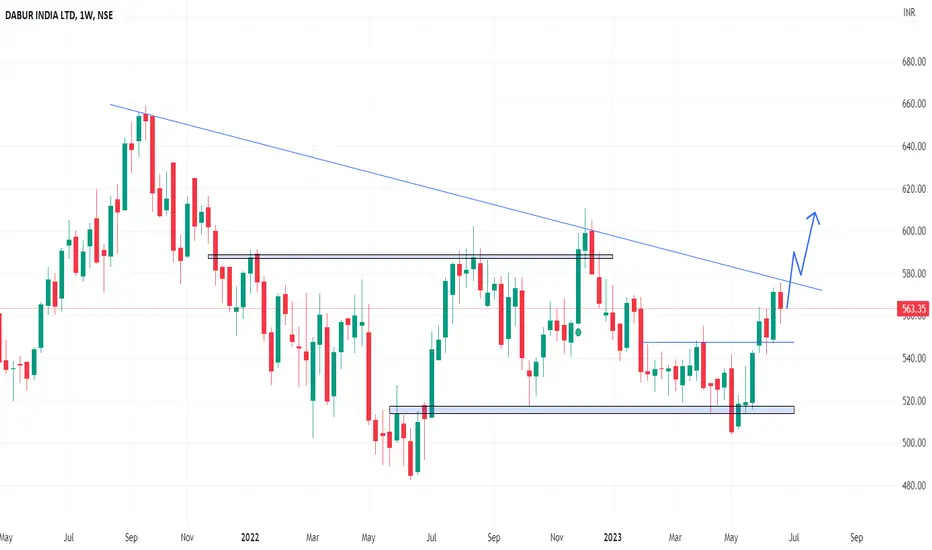
DABUR - Weekly AnalysisIn the Weekly Chart of DABUR ,
we can see that; it is building a strong Price Action towards Cup & Handle breakout.
Keep a watch for investing.
DABUR trade ideas
Dabur analysis! Read captionDabur is stilll in uptrend and this could be a possible pullback , I m planning a short trade below the mention price , and result will be updated on our Twitter.
If you are still watching some channels where they recommend already moved stocks, then must check our profile and past trades once, we provide proper RR through our analysis
DISCLAIMER - we don't advice anyone to trade on our analysis , it is just for education purpose

DABUR INDIA - Chart Analysis || 17th April, 2023 #stocks Analysis Criteria Used:
1. Please find the Chart Analysis done for DABUR INDIA
2. The analysis for the Trade ideas, has been done based on Trend analysis and Chart Patterns with Volume Buildups
Focus On:
1. Always keeping your Risk Management in play
2. Using a Stop Loss; because it is your Best Friend
3. Always Plan your Trade and stick to your Plan
4. Dont overthink or overanalyse
5. Treat this as your Business and get serious about it
#sharemarket #stockmarket #nifty #sensex #investing #trading #nse #bse #stockmarketindia #stocks #indianstockmarket #investment #stockmarketnews #banknifty #finance #money #intraday #intradaytrading #investor #niftyfifty #dalalstreet #sharemarketindia #sharemarketnews #stockmarketinvesting #business #sharemarkettips #stock #india #indiansharemarket #rakeshjhunjhunwala #bhfyp #mumbai #share #wealth #investment #market #invest #trading #investing #finance #FinancialFreedom #investor #trader #stocks #profit #investors #economy #equity #shares #nifty #stockexchange
DISCLAIMER:
.
* Please do your own research and/or contact your financial advisor before taking any trading opportunities
** We will not be responsible for your profit or loss
*** We are NOT SEBI REGISTERED
______________________
best stocks to buy today
best stocks to buy now
best stocks to buy
best stocks for Intraday tomorrow
best stocks for long term investment
best stocks to buy today india
best stocks for swing trading
swing trading strategies
swing trading beginners
what is swing trading
swing trading stocks
swing trading stock selection
swing trading kya hai
nifty analysis
nifty view
bank nifty analysis
top stocks to buy now
strong stocks
nifty view
nifty prediction
stock market view tomorrow
bank nifty Levels
bank nifty prediction
share news
stock market news
best stocks to buy now
profit booking stocks
multibagger stocks in discount
breakout stocks
best short term stocks
best short term shares
next multibagger stocks

DABUR BREAKING F&P PATTERNDabur giving breakout from F&P formation
good volume trading above 20ema
570 is resistance after that expecting 600
educational idea only

DABUR - Ichimoku Bullish Breakout Stock Name - Dabur India Limited
Ichimoku Cloud Setup :
1). Today's close is above the Conversion Line
2). Future Kumo is Turning Bullish
3). Chikou span is slanting upwards
All these parameters are showing bullishness at Current Market Price
and more bullishness AFTER crossing 571
#This is not Buy and Sell recommendation to any one. This is for education purpose and a helping hand to learn trading in Market.
# Cloud Trading
# Ichimoku Cloud
# Ichimoku Followers
I hope you all like my analysis.
Please do share your thoughts into comment section.
Please give a like, share & subscribe for daily analysis.

DABUR - Intraday Trade || 14th June, 2023 #stocks To be traded for Intraday today
14th June, 2023
DABUR
#intraday #stocks #priceaction
Analysis Criteria Used:
1. Please find the Chart Analysis done for the Intraday Trade Idea levels for 14th June, 2023
2. The analysis for the Trade ideas, has been done based on Trend analysis and Chart Patterns with Volume Buildups
Focus On:
1. Always keeping your Risk Management in play
2. Using a Stop Loss; because it is your Best Friend
3. Always Plan your Trade and stick to your Plan
4. Dont overthink or overanalyse
5. Treat this as your Business and get serious about it
#sharemarket #stockmarket #nifty #sensex #investing #trading #nse #bse #stockmarketindia #stocks #indianstockmarket #investment #stockmarketnews #banknifty #finance #money #intraday #intradaytrading #investor #niftyfifty #dalalstreet #sharemarketindia #sharemarketnews #stockmarketinvesting #business #sharemarkettips #stock #india #indiansharemarket #rakeshjhunjhunwala #bhfyp #mumbai #share #wealth #investment #market #invest #trading #investing #finance #FinancialFreedom #investor #trader #stocks #profit #investors #economy #equity #shares #nifty #stockexchange
DISCLAIMER:
.
* Please do your own research and/or contact your financial advisor before taking any trading opportunities
** We will not be responsible for your profit or loss
*** We are NOT SEBI REGISTERED
______________________
best stocks to buy today
best stocks to buy now
best stocks to buy
best stocks for Intraday tomorrow
best stocks for long term investment
best stocks to buy today india
best stocks for swing trading
swing trading strategies
swing trading beginners
what is swing trading
swing trading stocks
swing trading stock selection
swing trading kya hai
nifty analysis
nifty view
bank nifty analysis
top stocks to buy now
strong stocks
nifty view
nifty prediction
stock market view tomorrow
bank nifty Levels
bank nifty prediction
share news
stock market news
best stocks to buy now
profit booking stocks
multibagger stocks in discount
breakout stocks
best short term stocks
best short term shares
next multibagger stocks

DABUR FOR SWINGStock looks good at the current levels for swing action. Good volume and price action seen. Check chart for target and stop loss.
ALWAYS PLACE STOP LOSS

Dabur might show a strong reversal Dabur is standing on a strong trendline support and is near its 200 week EMA which also is a strong demand zone.
If the stock gives a breakdown from this levels and subsequently forms a strong bullish candle, it will be an indication of bear trap and we might see a strong rally on the upside.
Currently, the candle formed is bearish and hence, it is wait and watch. Keep this stock on radar.

DABURDABUR out of triangle pattern on daily charts yesterday & today it broke above rounding bottom pattern on hourly charts with good volumes.
Could be bought with mentioned stoploss & target.

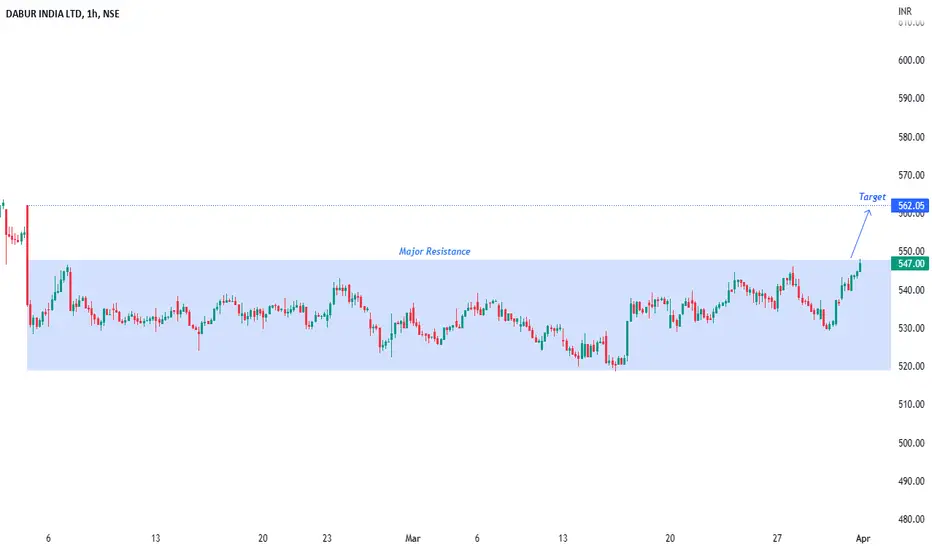
DABUR IN A CHANNEL Hourly chart of Dabur India is indicating that it is trading in a parallel channel daily chart is also good and gives a highest closing after 3rd February 2023 so if it will break the resistance of that channel on hourly candle basis we can go long for the target of 562 in it with the stop loss of a candle close below the resistance of channel.
𝑵𝑶𝑻𝑬- 𝑶𝑵𝑳𝒀 𝑭𝑶𝑹 𝑬𝑫𝑼𝑪𝑨𝑻𝑰𝑶𝑵 𝑷𝑼𝑹𝑷𝑶𝑺𝑬
Breakout in Dabur .....Its been consolidating for very long timeEnter at 530 and expecting a target of minimum 20% rally

DABUR INDIA LTD - Forming Reverse Flag PatternDabur India Ltd is forming a Reverse Flag Pattern and it is about to give a breakout at 528.
Based on the pattern, one can enter around 528 after the breakout and target can be set around 487 with Stoploss of 540.
This gives us risk to reward ratio of 3.3. Pattern is forming on hourly chart.
Disclaimer:
This idea is only for education purpose, Please consult your financial advisor.
I am not SEBI registered.

DABURDABUR made & broke out of bullish butterfly pattern on an hourly chart with decent volumes.
Could be bought with mentioned stoploss & target.

Dabur at 200 EMA WeeklyDabur is trading at its 200 EMA on weekly chart. It has formed Bullish Harami Candlestick pattern also. It has strong Open Interest Support (MAY 2023) at 500. RSI is currently taking support from 40 levels.
Support: 500
Resistance: 550

Falling wedge pattern reversal in DABUR INDIA LTDDABUR INDIA LTD
Key highlights: 💡⚡
📈On 1Day Time Frame Stock Showing Reversal of Falling wedge Pattern .
📈 It can give movement upto the Reversal Final target of above 540+.
📈There have chances of breakout of Resistance level too.
📈 After breakout of Resistance level this stock can gives strong upside rally upto above 598+.

Breakout in Dabur India Ltd...Chart is self explanatory. Levels of breakout, possible up-moves (where stock may find resistances) and support (close below which, setup will be invalidated) are clearly defined.
Disclaimer: This is for demonstration and educational purpose only. This is not buying or selling recommendations. I am not SEBI registered. Please consult your financial advisor before taking any trade.

Bearish movement This is for educational purpose.
Quarterly result negative & technical also a bearish pattern.
So there will be a downfall


DABUR INDIA LTD possible Elliot wave counts on dailyHello Friends,
Here we had shared possible Elliott wave counts on chart of Dabur India ltd. in which we can see that currently we are in corrective phase of this stock, On daily chart we can see that possibly we are in wave (c) of Y of (4), post wave (4) we can start fresh rally towards wave (5) in north direction, but currently we still have to complete corrective phase which is in complex correction pattern, so labeled as W-X-Y, in which we have completed wave W-X and now possibly we are in wave Y, also I'll mention here that in wave Y we have finished wave (a) and wave (b) and now possibly we are in wave (c) of wave Y, in wave (c) we have done wave i, and wave ii and now we are unfolding wave iii of (c) of Y.
Along with wave structures we are witnessing lots of situations in technical charts which are aligning and supporting same bearish bias, like negative crossovers, breakdowns, low relative strengths, RK's Mass psychological cloud etc. etc.
I am not Sebi registered analyst. My studies are for educational purpose only. Please Consult your financial advisor before trading or investing. I am not responsible for any kinds of your profits and your losses.
Please check snap shots shared below
Possible Elliott wave counts on Daily time frame.
Possible Elliott wave counts on Hourly time frame
Support breakdown along with good intensity of volume
Price broken down from ascending parallel channel with good volumes
RK's Mass psychological cloud and stop line both indicating bearish bias ahead.
Bearish Sequence in major moving averages 50DMA is below 100DMA and 100 DMA is less than 200DMA
Price closed below lower Bollinger band on daily time frame
Price closed below lower Bollinger band on weekly time frame
RSI below 40 is too bearish in daily
RSI below 40 is too bearish in weekly
MACD in daily negative crossover under zero level
MACD in weekly also negative
MACD in monthly already running in negative mode
DMI ADX both in bearish strength in daily chart
DMI ADX both in bearish strength in weekly chart
Most investors treat trading as a hobby because they have a full-time job doing something else.
However, If you treat trading like a business, it will pay you like a business.
If you treat like a hobby, hobbies don't pay, they cost you...!
Disclaimer.
I am not sebi registered analyst.
My studies are for educational purpose only.
Please Consult your financial advisor before trading or investing.
I am not responsible for any kinds of your profits and your losses.

Dabur- 610 PossibleDabur after breakout, reclaim of moving averages and RS being positive can move towards 610 levels.

Take on DaburDabur is now trading at value zones.
You can start accumulating between 530 - 515 levels.
Stoploss below ~501 levels
NSE:DABUR

VIEW ON DABURGood chart structure
Move after making a base around 510 levels
Target 539/545
Stop loss 528
I am just representing my views.
For educational purpose only.

DABUR BUY FOR 1:2 Dabur showing support+bullish engulfing +breakout retracement go for buy above high of last candle for1:2 triple confirmation trade
