Trade ideas

DABUR ( LONG) buy level -545 to 555
target - 580- 600-620
time- one month
KAUTILYA can recover Your losses with Quantitative analysis and grow the CAPITAL
NOTE – EDUCATIONAL PURPOSE
(Consult your financial advisor before any decision)

ITS DABUR'S TIME TO ROAR INTRADAY/SWING#40 (GENIE IDEAS): I will daily post intraday/swing/positional trading opportunities so u can analyse and get the most from it. if you like my analysis do like and follow me as a token of appreciation.and if you have any queries let me know. I have also posted my views on stocks which on the verge of breakout indraprastha gas, ubl , castrol, hindustan unilever, jindal steel, india bulls.

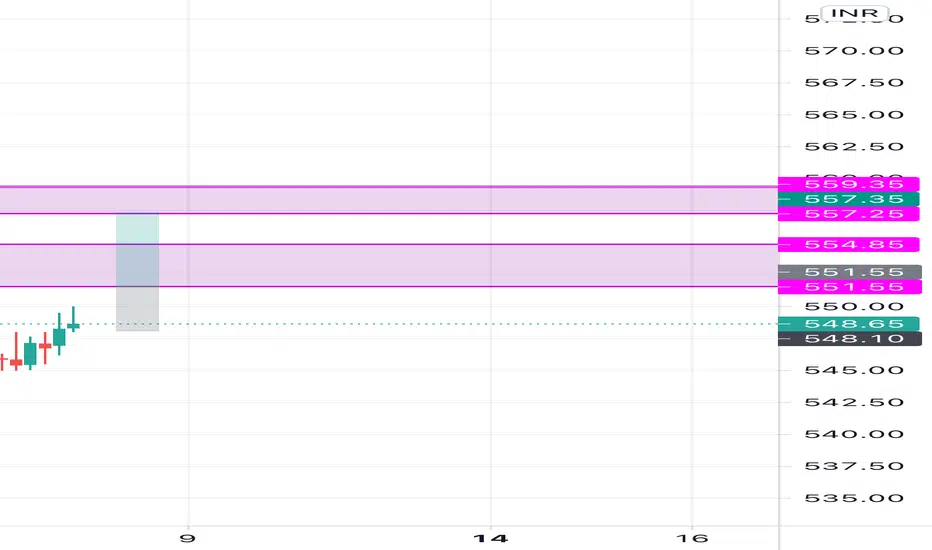
intraday idea for tomorrow #equity #daburbuy above the green horizontal line only if it close above it. targets are between the 2 horizontal red lines.
targets are mentioned.
buy only if its closes above mentioned point.
stoploss can be placed below trendline.

ONE MORE FROM FMCG OR CONSUMERMARKET STAGE 2 , SECTOR CONFIRM STAGE 2 , STOCK IN STAGE 2 😂
FOR EDUCATIONAL PURPOSE ONLY
IF S1 HIT TRY TO MAKE POSITION NEAR S2 AND IF IT GO BELOW PRIOR SWING LOW MOVE OUT OF TRADE
AS NOT GOOD AT PUTTING STOPS
AS VOLUME AND RS IS NOT TO SUPPORTIVE
EVERY TRADE HAVE A PROBABLE OUTCOME✌🏻

look for long entry logic - the stock have given multiple level test. the zone looks weak we can enter long once the level is taken out if we see a small buildup then we can get a good move - simple analysis ( I'm not a financial adviser I just share my clean simple techniques ) less noise in the chart (( short term entry) enter with proper risk management
risk what you can consume

Buy DaburBuy Dabur near 515 area stoploss 495 Target 550
Study :Stock trading near Fibonacci Retracement level (78.6%)

Dabur - Coming out of Accumulation soon!The volume on the bearish candle was concerning but the Bulls absorbed all the supply and hence the next candle was a hammer. The price is in a range/accumulation phase. An ambush entry can be taken with the previous low as a stop loss. A safer entry can be taken after the break of the range on the upside.
Targets: 547, 562, 578.
You are always advised to use an appropriate Risk-Reward ratio as per your strategy.
P.S: This is NOT investment advice. This chart is meant for learning purposes only. Invest your capital at your own risk.

DABUR LtdBuy Above ₹540
(P.S: This is NOT investment advice. This chart is meant for learning purposes only. Invest your capital at your own risk.)

Dabur - failed Head and shoulder pattern- bullish ?Why I took long ?
Failed head and shoulder pattern - this can move the stock up for sometime
Multiple support formed and respected making Higher highs
Cheers :D


Dabur-Longtime consolidating between 500-540If it breaks and close below 534 then one can easily take short entry by keep SL-551.
Target- 526, 516, 500,493

Swing opportunity in DaburGo Long above 544.4 for Targets of 559.25, 574.1 with SL 529.55
Reasons to go Long :
1. If we draw Fibonacci Retracement from recent swing low (Point A) to recent swing high (Point B) on a 1 Day chart we see the stock is taking support of 0.618 Fibonacci level.
2. Around 0.618 Fibonacci level, we can see that the stock is forming double bottom (W pattern) which is bullish.
3. In addition to this the stock gave trendline breakout.

LONG ON DABUR INDIAHii Alll
There good buy opportunity in Dabur India with 60 % retracement in Dabur India
#Nifty #NIFTYFUTURE #NiftyBank #Trading #StockMarket #Sensex #TradingView #Nifty50
#Niftymetal #NiftyIt #Niftybees #Niftyrealestate


Multiple Touches, Head and Shoulder Formation.Details on Chart
Note: This analysis is only for educational purpose.


Dabur - Better Positioned in the All Time High MarketDabur is better choice for low POSITIVE return in the All Time High Market environment.

