Ascending triangle this is DABUR chart in 1hr time frame, forming a ascending triangle pattern. Breakout on any side can give a good move for intraday. Intraday levels are shown in the chart.
Trade ideas

Dabur for educationBuy - 520 or 500, target - 560 or 580
In mid term.
Only for education purpose, keep on your watchlist or radar.


Buy Dabur Long Dabur above 538 SL 525 TGT 575-580 . Stock trading in the range & expected to touch the upper trendline. Good risk to reward trade. This is for your educational purpose only.


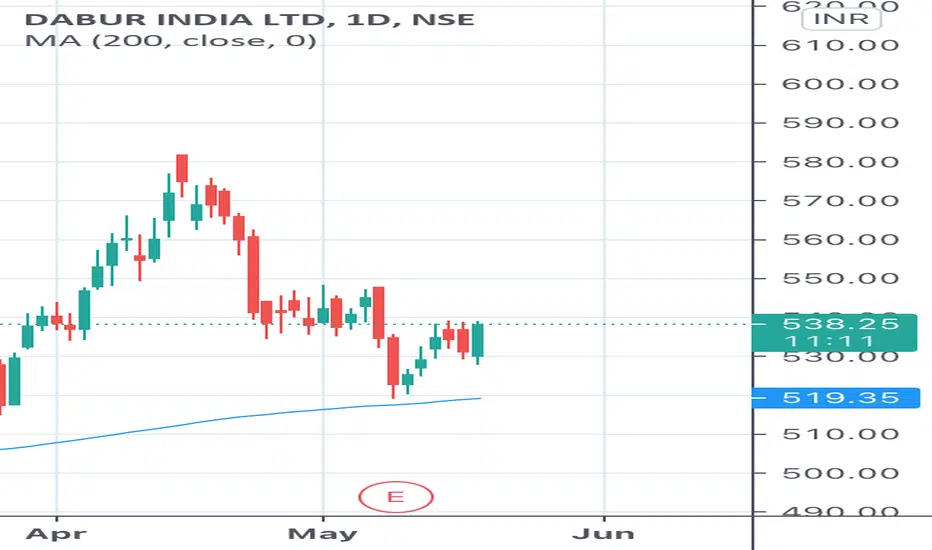
BULLISH Signal For Short TermSupport 519 and forming a triangle with good past support, 1 R1 s38 , tg 565, 585

is this Double Tops PatternHello guys im a new investor, and i want to learn to identify the patterns and, i have tried for this company myself, if any1 of u guys could tell me if this is Double Tops Pattern or smtg else it would be amazing :)

DABUR DING DONG in MAYsupport and resistance level mark
no loss strategy
sell call 560@4
sell put 515@4
total points 8
gain 1250*8=10000
open for discussion
wait till expiry
enjoy profit
find me everywhere

Dabur trade setup activated Dabur stock bounce back from weekly demand zone, we can see a good upside movement from here.
5th April weekly candle created a new high , hopeful this time we can see again new higher high.
Entry -530.05
Profit-559.55
SL- 515.30
If entry missed then take entry at @CMP


Dabur in a good rangeDabur has taken a support at its trend line we can see a good rejection so the good opportunity is seen on a buy-side a good stock that can form a part of portfolio.


Dabur : long Dabur :
CMP : 529
Stop loss : 519
Target 1 : 540; Risk to reward : 1 : 1
Target 2: 547; Risk to reward : 1 : 1.8
price moving in channel; has strong support at 200 day SMA. Target is 44 day SMA, then next resistance.


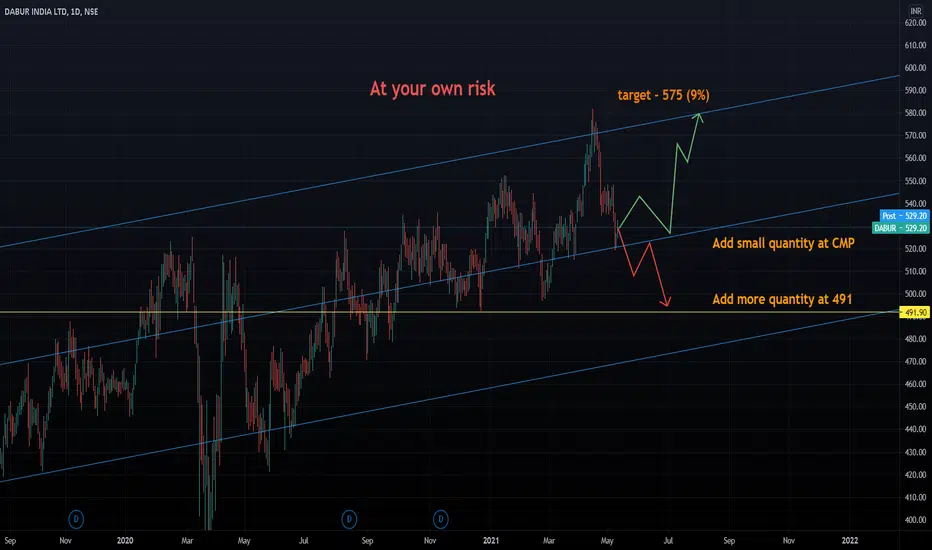
Dabur Ltd - Parallel Channel Dabur Ltd script has moving in Ascending Parallel Channel.
The script has touched the Channel Resistance and Moved back to Channel Support and then it was Moving to the resistance level.
The script was in the bottom of the channel region.
Hence, we can go for Long.
Buy - 520-525
SL - 517
Target - 570

Go long Company is almost debt free.
Company has a good return on equity (ROE) track record: 3 Years ROE 24.88%
Company has been maintaining a healthy dividend payout of 46.07%
Debtor days have improved from 30.46 to 21.44 days.

Long reversal expected if market sustain at the current levelLong reversal expected if market sustain at the current level

DABUR - ShortMarket is reacting to the bad quarterly results and traders are enjoying with short positions.
Rest information is already there in the chart itself.
