DABUR WEDGE PATTERNThe stock has taken support at the trend line we can expect a move upwards towards 570++
Trade ideas

DABUR : Ready for the flight UP.. My wave analysis suggest that a BUY is coming soon..
Happy Trading..


Go long with DaburLook at yearly chart, stock has given tremendous result every years contentiously.
No red candle since last 10 years.
Currently i daily demand zone supported by EMA 20


Indecision moment wait for trend reversal or breakdown Friends don't trade blindly , I'll wait for break down or trend reversal then go for long or shorts


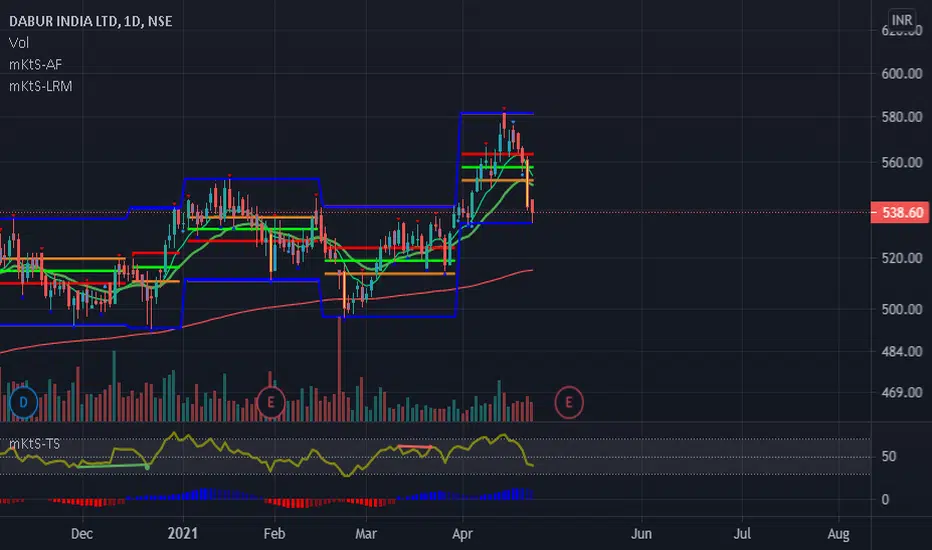
DABUR looks weak !!!DABUR : cmp: 538.6
Looks weak in D & W chart. A big bearish candle has been formed in both chart.
Below 533 stock may go upto 510 lvl.
So sell on rally for d TGT 524/513
SL 551.75 clbs
Disclaimer: Ideas for learning Only.
Learn Regularly. Not occasionally.
DABURTHE VALUABLE COMPANY BABUR GIVE A BIG RALLY 500 TO 575. NOW IT IS IN REVERSAL SO NOW SELL THE DABUR. AND WAIT FOR SUPPORT THE FIRST SUPPORT IS 550 AND THE SECOND SUPPORT IS 339.

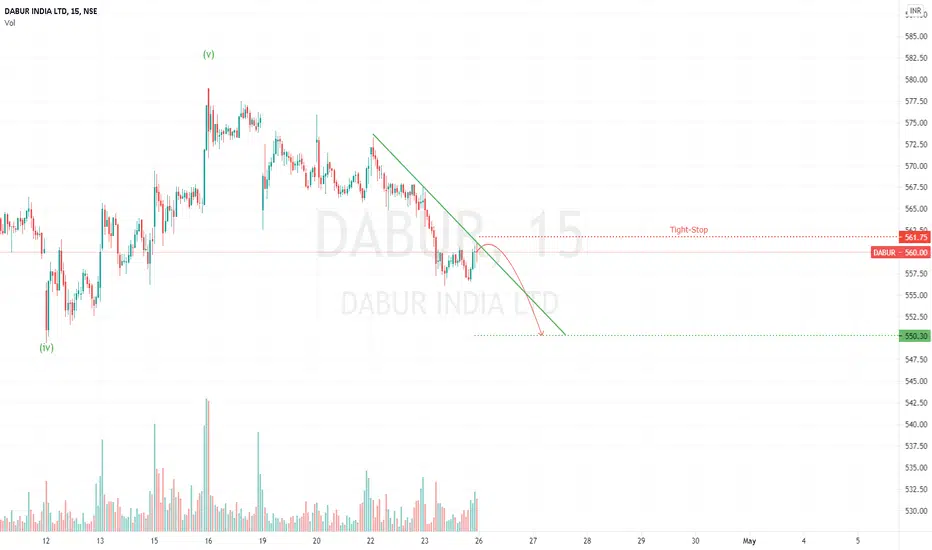
DABUR: Correcting-Expecting a healthy correction till 550 before it can resume it's previous up-trend
/*
Please do NOT consider these as trade recommendations.
I' am an amateur and posting these charts helps me understand the market better.
I' am open for suggestions/advice.
*/
Dabur CMP: 572After a long time it has broken consolidation range. It has also given Wedge breakout on the daily chart. We can expect Pattern target as 655 to 695 in mid term. All indicators and oscillators are indicating bullishness. Above 25 ADX will add more strength to the trend.


Trading Idea | DABUR Dabur the FMCG stock is trading at All Time High and on Technical front stock is looking strong in Mid Term View. Stock has broken a Rising Trendline on weekly chart which was facing resistance. Stock is broken this 2.5 Year Trendline Range and well Trading above it since 2 weeks with good volume.
One can look to Buy dips in Dabur around 560 to 540 Zone for Target price of 605 and 625. Stoploss should be kept at 532 below closing.
Trading Idea : DABUR Buy 540 to 560 (cmp571) Stoploss 532 Target 605 -625

Best time for buy Duber - price will shoot upto 615 and 700 Best time for buy Duber - price will shoot upto 615 and 700 next 3 months.

DABUR 1D CANDLE ASCENDING CHANNEL PATTERNDabur ltd 6months channel pattern.
wait for the next candel.
(Trading is probability)

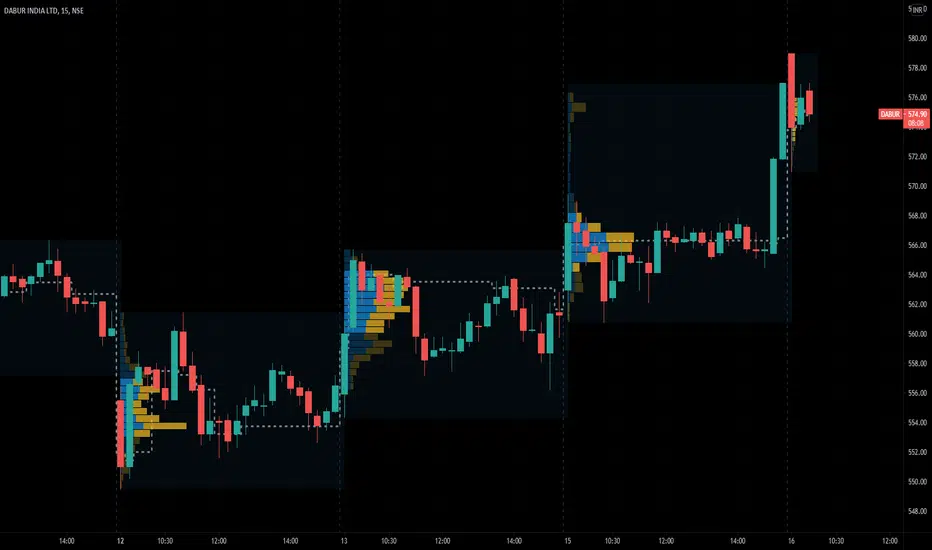
Dabur Volume Profile Indicator showing further Upward MovementDABUR is expected to show further strength in the upward rally
DABUR 1D analysiswe've already analysed Dabur on 4th of April but for some reasons it didn't go public
But now it has performed according to our analysis and it has decisively broken the pattern
It might retrace a bit before it makes new highs
for some reasons we are unable to paste the previous analysis link
we've spotted this stock at 538 after the break of the trendline
I'm not a SEBI certified analyst, This analysis is solely for educational purposes.

DABURGood Breakout In Dabur
Dips to 550 can be baught
SL 533 on closing basis
for slightly long term, accumulate on dips with SL on close below 490

DABUR ready for a breakoutDABUR is breaking out of the channel pattern and is likely to touch 600 in the short term.

