Inverted Head and Shoulder breakout formation in Dabur India.Dabur India. Best Funda stock is ready for Breakout.
Market Cap: 1,17,353
CMP: 662.50
PE: 63.5
Debt is negligible.
Last quarter OPM and Net profit increased.
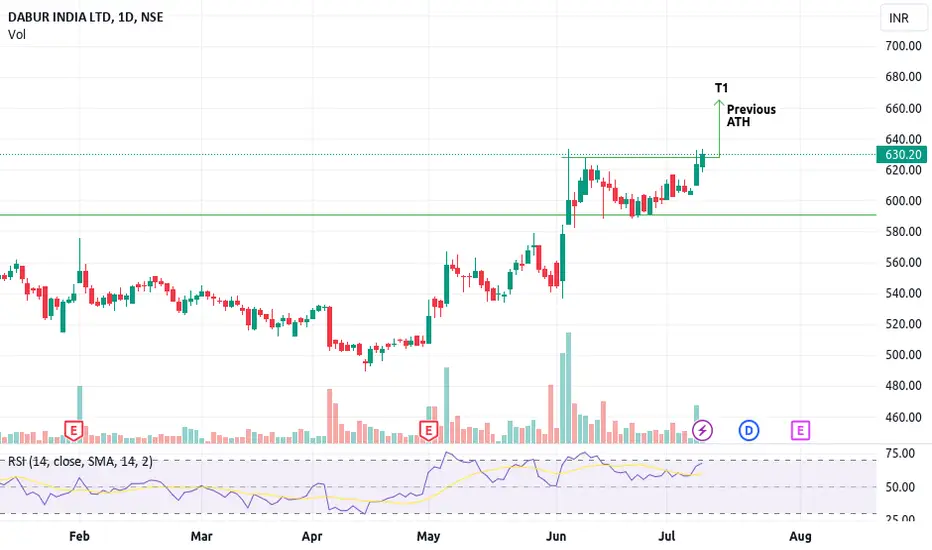
Today FMCG Sector shown a Breakout, so Dabur also in the verge of the Breakout maybe giving a sustainable breakout and further rally.
Entry above 665.50 closing of 1Hr candle for a short term target of 10% from current level.
Trade ideas

Dabur Inverted HnS BreakoutDabur inverted HNS Breakout on Daily TF with supporting volume. Expecting it to hit 720 in the coming days. Comments and discussions are welcome.

Dabur - Cup and Handle - Breakout - DailyDabur -Cup and Handle - Breakout - Daily
Price closed above 3years high .
Name - DABUR
Pattern - Cup and Handle breakout
Timeframe - Daily
Volume - Good
Cmp - 662
Target - 832
SL - 659
Always welcome for any comments with your feedback or give it a like if you find it useful.

DABURNote:
1. Views are personal and for educational purposes only. Recheck and take the trade as per your RR.
2. Always remember SL is your lifeline, not the big target...
3. Follow us for more patterns and like, share so that we feel it is helpful to many and share more patterns...
3. Views given here is not a tip rather it is for educational purpose... Aftermarket opens, the condition might change so learn to handle different conditions...
Keep an eye ladies and gentlemen. Cheers and Happy Trading

Dabur India Ltd- STOCK ANALYSIS
Dabur India Ltd- STOCK ANALYSIS
Key Observations:
Current Price: ₹644.40
Resistance Level:
The stock has been trading around ₹644, near its previous high.
There is a marked upward projection of 23.70% (154.25 points), indicating a potential target price of ₹800.
Support Level:
A previous support level can be seen near ₹475, as indicated by the significant fall of 25.83% (-168.65 points) in the earlier period. This forms a strong historical support zone.
Potential Move:
The chart shows a possible upward movement of 23.7%, suggesting that the price could rise to ₹800 if it breaks above the resistance level.
If the stock faces downside pressure, it could revisit earlier support zones around ₹475-₹500.
Volume Indicator (CVD - Cumulative Volume Delta):
The CVD shows a significant selling pressure with -315.539K, indicating a bearish sentiment in the market for now.
Analysis:
Bullish Scenario: If the stock breaks through its current resistance at ₹644, it may move towards ₹800, gaining about 23.7% from the current price.
Bearish Scenario: On the downside, there’s a risk of a pullback to around ₹475-₹500 if the stock does not sustain above ₹644.
Neutral Scenario: The stock is at a critical level near ₹644, which is a pivot zone for deciding the next major trend.
Conclusion:
The stock is currently positioned at a key level, and the next move could either be a breakout towards ₹800 or a retracement towards its support zone near ₹475. Watch for price action and volume to confirm the next trend. The 23.7% target price gain is appealing for a bullish move, while the downside risk remains at about 25.83%.

Dubar - near Multi Year BreakoutDubar - near Multi Year Breakout
Disclaimer:-
This is only for educational purposes. The author is neither a registered stockbroker nor a registered advisor and does not give investment advice. His comments are an expression of opinion only and should not be construed in any manner whatsoever as recommendations to buy or sell a stock, option, future, bond, commodity, index, or any other financial instrument at any time


DABUR BUY or SELLThe idea here is to check long term resistance. As stock already pulled back from its resistance level, and still trying to break it with some volume but couldn't. In long term scenario, its the sign of a possible breakout in near future. It could be in coming weeks.
There is a short term trend which also provide support to price but if it breaks, then there could be a slight down trend. And it might stay for short period of time. In that case its the best strategy to BUY at every dip.
Chart is 1D bar chart, so if breakout happen then it might give atleast 25-30 percent return in coming months.
NOTE: This is just for educational purpose only. Please consult your financial advisor before placing trades.

DABUR! Short term easy target.Weekly chart gives a complete description.
Trading near ATH levels.
Retest complete for the previous breakout.
Large Cap with good fundamentals.
For educational purposes only. Not a buy/sell recommendation.


DABURBased on price moving and Ema
positions Up move possibility is higher
This is only for educational purposes.

Dabur India has given Breakout of Bullish Triangle PatternHello Everyone,
I hope you all will be doing good in your trading and your life as well, i have a stock which has given a bullish triangle pattern breakout on weekly timeframe. Stock name is Dabur India and it is one of the leading fast moving consumer goods (FMCG) players dealing in consumer care and food products. Dabur India Limited is the fourth largest FMCG Company in India and the world’s largest Ayurvedic and Natural Health Care Company with a portfolio of over 250 Herbal/Ayurvedic products.
Market Cap
₹ 1,09,930 Cr.
Current Price
₹ 620
High / Low
₹ 634 / 489
Stock P/E
60.7
Book Value
₹ 55.7
Dividend Yield
0.84 %
ROCE
22.3 %
ROE
19.2 %
Face Value
₹ 1.00
Industry PE
44.5
Debt
₹ 1,365 Cr.
EPS
₹ 10.4
Promoter holding
66.2 %
Intrinsic Value
₹ 145
Pledged percentage
0.00 %
EVEBITDA
38.4
Change in Prom Hold
0.01 %
Profit Var 5Yrs
3.89 %
Sales growth 5Years
7.81 %
Return over 5years
8.67 %
Debt to equity
0.14
Net profit
₹ 1,811 Cr.
ROE 5Yr
21.6 %
Profit growth
7.26 %
Disclaimer:- Please always do your own analysis or consult with your financial advisor before taking any kind of trades.
Dear traders, If you like my work then do not forget to hit like and follow me, and guy's let me know what do you think about this idea in comment box, i would be love to reply all of you guy's.
Thankyou.

DaburDabur has shown increases eps and sales earnings. There has been a pattern breakout. It can show good upside momentum is sustains at and above 600.
Let's see how it performs in upcoming quarters. Its just for study pupose not a reco.

Dabur India bullish pennant flag-bullish pennant flag pattern
-trading at weekly support S1
-large cap stock
- 5th time touching this level and getting reversal
this analysis is for learning purpose only.
It is just a view, please trade at your own risk. I'm not SEBI registered adviser.

Dabur India - SWING TRADE ON BUY SIDE Long Trend Line Break Out on Weekly With Good Volume .Its been in consolidation For last 3 years.
Educational Ideas
To motivate us, Please like the idea If you agree with the analysis.

BUY TODAY SELL TOMORROW for 5%DON’T HAVE TIME TO MANAGE YOUR TRADES?
- Take BTST trades at 3:25 pm every day
- Try to exit by taking 4-7% profit of each trade
- SL can also be maintained as closing below the low of the breakout candle
Now, why do I prefer BTST over swing trades? The primary reason is that I have observed that 90% of the stocks give most of the movement in just 1-2 days and the rest of the time they either consolidate or fall
Inside Bar Breakout in DABUR
BUY TODAY SELL TOMORROW for 5%

Dabur India is Trading At Strong Support ZonePositional Trade #DABUR INDIA
BUY @504 For Target @600
Fundamentals is good
Currently Trading at Strong SUPPORT ZONE
it is purely educational purpose only.

Dabur India Hold This week
Risk 1:5
SL 1Hr candle close only, Target Trigger Price
All detail for chat. good entry at mark price only. and must stoploss minimum risk and good profit. risk ratio 1:1 in first target. This is not call, Just my idea. Please understand your risk and take full responsibility of your actions

Dabur - the next ITC Dabur
- Year high volumes after earnings candle
- Bounce from same breakout area
- Fmcg sector is bottoming out

DABUR - SWING TRADE ON BUY SIDESymbol - DABUR
Dabur is currently trading near support zone of 500 - 510.
DABUR CMP - 506
I am initiating long positions in April Futures.
My SL would be 498 & Targets would be 525 & 540
It may move slow but it should move up from here.
Disclaimer - Do not consider this as a buy/sell recommendation. I'm sharing my analysis & my trading position. You can track it for educational purposes. Thanks!

Dabur (NSE) is on the verge of Weekly BreakoutDabur (NSE) is on the verge of Weekly Breakout with good volume. Its been in consolidation For last 3 years. It is in the great position to give the breakout soon.

DABUR 1HR- EARN WITH ME DAILY 10K-20K -
DABUR Looking good for Downside..
When it break level 556.55 and sustain.. it will go Downside...
SELL @556.55
Target
1st 550.95
2ND 545.90
DABUR MAY FUT – LOT 8 (Qty-10000)
MINIMUM 10L CAPITAL
Enjoy trading traders.. Keep add this STOCK in your watch list..
Big Investor are welcome..
