#DABUR WEEKLY CHART VIEWDabur India Ltd.
Their is no huge changes visible
The price is maintaining same sideways trading sentiment.
515 is immediate resistance and 494 (5MA) - 490 are supports.
Breakout from mentioned support and resistance can unfold up move towards 525-530 on the up side and 480 - 475 should consider as sown side supports below 490.
Trade ideas

DABUR is Making Strong SR Channel Pattern (Breakout Trade)Dabur : Fast-Moving Consumer Goods Company ( NSE:DABUR ) is Making Strong SR Channel Pattern (PATTERN BREAKOUT TRADE).
This can become a very good trade for INTRADAY traders.
Target + StopLoss: There is no target here. You keep the first target as much as the StopLoss you put. And the StopLoss will be the Low/High of the candle that broke this pattern. Or Low/High swing backward inside the pattern.
And as soon as you get a profit of 0.50% of your target, you will trail your StopLoss and bring it to the entry point. And as soon as your first target is hit, you will release half of your total quantity and continue to trail your StopLoss above the last swing Low/High.
Target and StopLoss are never already fixed in the chart pattern.
Thank you.
You always have to trade only by money management, position sizing, StopLoss trailing. This is the way to stay in profit.
Chart Published By Ravinder Sharma

DABUR - 1D TF - Cup & HandleCup & Handle pattern forming on Daily Chart of DABUR. BUY 520, SL 469.9, Target(s) - 570, 600. All-in above 530. Cup Depth = 95. I'm learning chart patterns as of now. You can plan your trades accordingly if you know how to trade these patterns.


Long Dabur above 515 and 525 on closing basisLong Dabur above 515 for target of 525 and once breakout above 525 on closing basis for target of 550-575 by keeping stop of 495 on closing basis and 510 on intraday

Dabur long entry can be taken.W+D BO done.& closing above the level of 500 the sign of bullishness. Long entry can be taken above the price of 510 for the target level of 530-540 SL 488.
always do trading as per your Reward to Risk ratio .The ideas sharing is for educational purpose only. In case any suggestion advice required feel free to ask.
Watch the August month performance sheet. All trading ideas freely shared here for your education & support.
drive.google.com

DABUR: BullishSymmetrical triangle pattern breakout. Buy with SL of 480 for the target of 510-515 zone

price is contracting, ready for a big up-move above 525a decisive close above 525 can trigger a big upmove

DABUR WATCH THE STOCK ABOVE THE LONG TERM RESISTANCE LEVEL OF 528 ,CONFIRM THAT THERE IS VOLUME WHEN BREAK OUT. RECOMMEND FOR INTRADAY. BOOK THE PROFITS QUICKLY,DON'T WAIT IN HIGHLY VOLATILE MARKET( INTRADAY POSITIONS).THE RECENT CANDLE SHOWS THE BULLISH STRENGTH OF THE STOCK.

DABUR LONG TERM ANALYSIS AND TRADEDabur is making a bullish triangle formation and appears to be near completion. It has formed 6 points of contact on the trendlines. The price may perform a breakout above 525, which is the current high.
The RR is favorable with a stop loss @ 470.
FMCG sector has been fairly flat for a while now and I am expecting some momentum to pick up in the coming weeks.


DABUR - SWING TRADE (Discussed Earlier)The time has come for dabur. The breakout happened and those who followed me must be in good profits. The stock is set to give more than 15 points. So wait and take informed decision.
this is for educational purpose only.
thank you
happy trading.
check out my analysis on dabur posted sep 2.

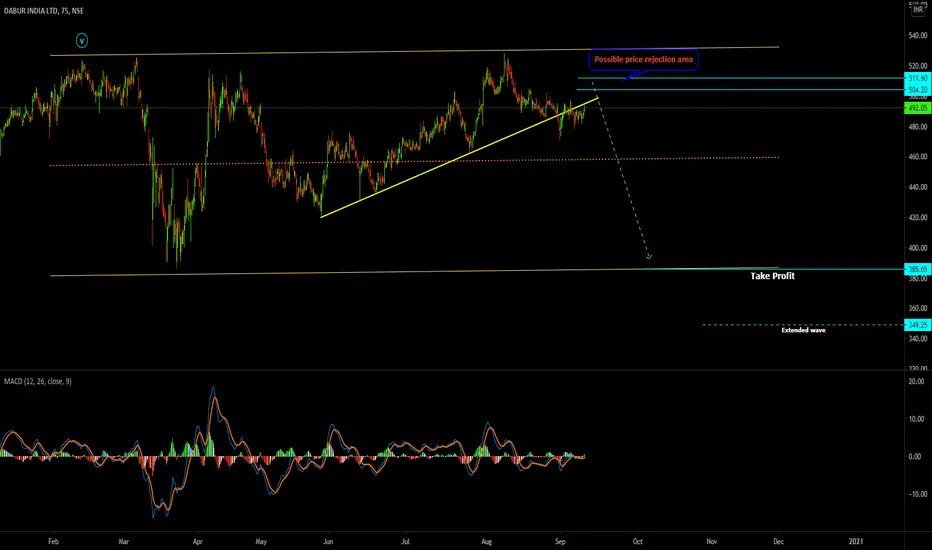
Short sell set up One can wait for price to tag 504 or 512 and reverse completely as bearish Candle , sell on brake of that bearish Candle
and stop would be above the candle high you sell and let the trade run for a while
booking using trailing stop when it starts nearing the take profit area , its high likely some time due to momentum of market participants
the price will extend its move , which is also forecast in this chart
Good luck
Dabur Symmetric traingleDabur trading in symmetric traingle, take entry after break out is confirmed in 15 mins candle. Close price of 15 mins candle should be above 495.


DABURINDIm not an expert im just sharing my views on DABURINDIA for tomorrow
Im not responsible for any profit or loss this is not a recommendation


4 SEPTEMBER DABUR BUYDisclaimer: We Are Not SEBI Registered.
All Information on chart are for educational purpose.
BUY @ 494 SL 489
TGT 500++

Buying Opportunity in Dabur..!!
****Disclaimer****
Trade with risk management but don't get afraid of taking risks because the winner is who BETS as well as never gets out of CHIPS...!!


