DLF POSITIONAL TRADE SETUPDLF Share are near to breakout 340 is a crucial level.
.
So this share can breakout on tomorrow or can give the breakout on 2nd of August.
.
According to trendline. So keep eyes on this stock.
.
What's your view on this comment below in the box.
DLF trade ideas


DLF Positional View !DLF : cmp : 333.95
A cup & handle kind of pattern had been formed in daily chart.
Bo done near 320 level.
Making higher highs for 3 days.
Now trading near the resitance of 340 level.
If it surpass and sustains above the level a fresh buying move possible.
So good to grab above 340 for
the TGT of 357/372/398
SL 315
Option Strategy : Sell July 335 PE @ 8.5-10 tgt : entire premium
OR
buy Aug 340 CE @ 12.5-15 tgt 22.5/25
Disclaimer: Ideas for learning Only.
Learn Regularly. Not occasionally.

DLF - Ready to breakout Beautiful cup and handle patter on weekly and daily charts.
Although around 320 was a good level but can buy at CMP
Stop - 299

DLF has formed a Cup and handle patternDLF has formed a Cup and handle pattern in the Daily frame.
Entry Above 300
First Target 380
Second Target 398
SL 280
Note: Educational purpose only.
NSE:DLF


Slow & Steady but will reach 500!Stock is under consolidation for years now. Currently it's trading in upper band of channel and moving along the curve. May take some time but it's definitely reaching 500, and then a new ATH. Stay invested! :-)


#DLF can give 20% moveDLF is looking bullish... See the chart
Overall realty sector is exploding..prices are on the rise..
Next stop would be around 390

DLF BULLISHAfter completion of a successful cup and handle pattern, DLF still has a lot of momentum is left in it.
We can still capitalize on the trade, tgt-entry-sl marked on the chart

Buy DLF @ 334~ T- 391(Could go much higher) SL 314Buy DLF @ 334~ T- 391 SL 314.
The probability of this trade is a bit lower. However, target appears to be achievable.
It forms a good cup and handle breakout with a retest and a follow-up breakout again.
This appears to be a good setup for trend until 391 at this point.


DLFPRICE HAS BREACHED ITS MULTIYEAR RESISTANCE LEVEL..AND RETESTING IT...IF IT SUSTAINTS..PRICE WILL MOVE UP


DLF Chart AnalysisDLF
cmp 321
Head and Shoulder pattern
Below 321 moves to 311
Sl 325
MACD bearish crossover
RSI below 50

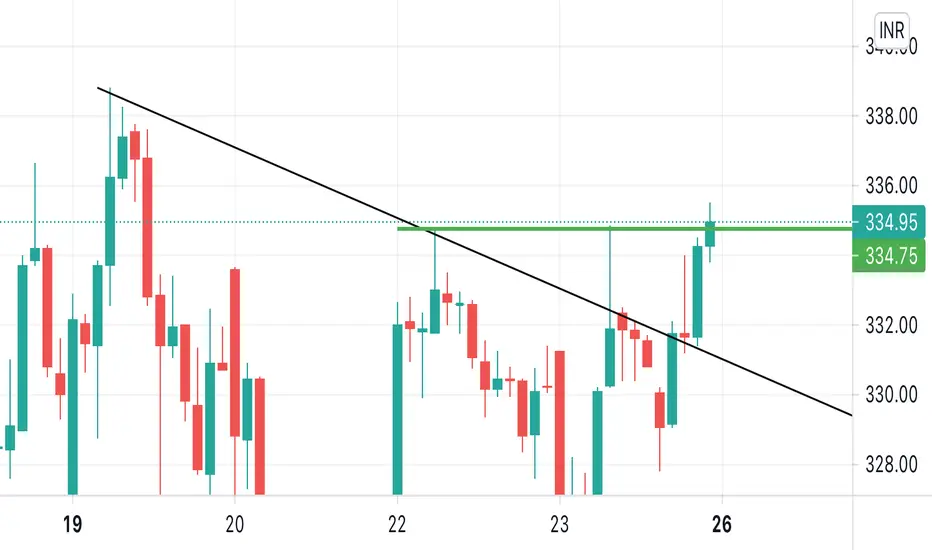
'DLF' intraday opportunity for 22nd July 2021Buy/Sell only on given levels. The above chart is only for educational purpose. Make sure you don't trade blindly, reanalyze and trade


DLF: Deja vu close observed near resistanceDLF
This pattern occurs when two green days appear with equal closes in an uptrend. It might indicate a short term top has been reached.
- A new high was made today but there was no follow through buying, which bought it back to previous day's close.
- Interestingly this has happened near the high made in March 2021
- It could be a case of a good resistance price.
Explaining the pattern :
- The stock has been higher, as evidenced by strong green candle on 18th July (previous day).
- The next day, the stock opens lower but then it recovers back, tests the previous day's high but eventually closes at the same / similar price as previous day. This is possibly an indicative of short term resistance and may cause much concern with the bulls.
Entry can be considered when midpoint of previous day's green candle is broken.
SL can be kept at the highest point of last 2 trading sessions
________________________________________________________________________________________________________
- the last 2 days F&O volume has been the highest in this series and is almost 3 times the average volume of previous 16 trading sessions
- however the Open Interest has not increased at all.
Which prima facie, suggests change of hands, rather than fresh buying interest.
F&O strategy for the given set up
Consider selling July expiry 340 Call option between 5 - 7.5
Closing price is 6.05
If selling at 5, The strategy will have a max profit potential of Rs 16500/- per lot till 29 July.
More importantly, it would have an inbuilt loss protection for a rise up to 345 till expiry.
Trust you find the overall analysis useful.
Like & Follow
But don't just follow me blindly
Learn to identify opportunities independently
