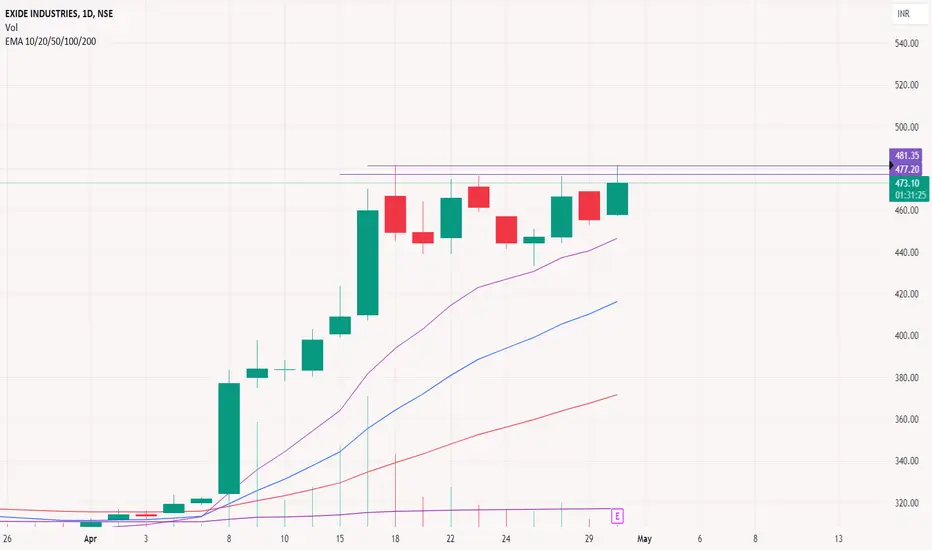
EXIDE INDUSTRIESI see a flag pattern breakout.
The flag is a narrow horizontal one signifying strength.
Targets in green.
Stoploss as per risk appetite.
EXIDEIND trade ideas

Exide - moving towards ATH Exide Industries has reached ATH. We can expect the price to move towards 575-700. Other factors:
1. Volumes are increasing
2. RSI is above 60 showing bullishness in stock
3. MACD is becoming positive
4. Highest TTM net profit
"Clear Charts, Easy Charts"
Learning & Earning!!!
Cheers!!

Short Term Swing Trading Idea in Exide Industries for 25% UpsideHi,
NSE:EXIDEIND has given a Bullish Flag Breakout on Daily charts with very good volume.
MACD is also on the bullish side on Daily, Weekly and Monthly time frames. RSI is also on the bullish side on daily, weekly and monthly time frames.
In the current market scenario, I am expecting that the bullish momentum will continue.
Complete price projection like entry, stop loss and targets mentioned on the charts for educational purpose.
Don't Forget to Follow me to get all the updates.
Please share your feedback or any queries on the study.
Disclaimer: Please consult your financial advisor before making any investment decision.

EXIDEIND #NSE - FLAG PATTERNEXIDE INDUSTRIES
Forming a FLAG pattern in daily time frame
Disclaimer:
For educational purpose only.
Please do your own research before taking any trades.
Happy Trading!

Exide above 495 will be a good opportunity for TRADING ( 490 CE)If Exide price sustains above 495 in day candle, Traders can try
try 490 CE for may month month.
Strict SL is required as per your risk management.

All time high breakout with trendlineGood volume build up in daily time frame.
Breakout of all time high trend line with good volume.
RSI above 70.
NOTE: I do my analysis, do yours before trade.

Exide Industries: Flag and pole PatternExide industries is forming a Flag and Pole Pattern and consolidating. If it breaks, Entry ~ 486 (Candle Close), Target 1: 540-550, Target 2: 575-585 and Target 3: 620-630, SL: 429
Positional Trade: Long period
Disclaimer: Study only for Educational Purpose.
Remember: My Money, My Risk, My Reward, My Responsibility.
Please Consult SEBI registered Financial Advisor for any Financial Advice/ Decision.

The flag pattern is a popular chart pattern used in technical The flag pattern is a popular chart pattern used in technical analysis. Traders can enter into a trade when the price breaks above or below the upper or lower flag trend lines. The main step is to look for a sharp price move followed by a consolidation period that forms a flag shape to trade for flag patterns

Flag & Poll Pattern Flag & Poll Pattern
EXIDEIND
+ Building up at the resistance
+ Good Volume buildup
+ Above Key EMAs
-: Not a Buying recommendation

Exide Industries G1 Bearish BAT Harmonic Pattern Exide Industries G1 Bearish BAT Harmonic Pattern
.
.
PRZ1 - 284.20
PRZ 2 - 283.30
PRZ 3 - 274.35
.
.
.
Stoploss - 304.70

Buy Exide Industries Short Term Trading Advice by Goodluck Capital
Buy Exide Industries
Buy Range- 480 - 490
Target- 530 - 535
StopLoss- below 460
Potential Return- 9-10%
Approx trade duration 14 - 15 days

EXIDE IND Please consult your financial advisor before investing.This is only for learning purpose of chart.
We are NISM certified EQ and MCX trader but SEBI register not investment advisor.
You can connect me on INSTA for further query at _prem_.23
Exide has given a good rally after that was in a zone but from last 3 days good volume is being seen with bullish candle stock can give a good big rally again.....

EXIDE INDUSTRIES - All Time High BreakoutEXIDEIND
1) Time Frame - Monthly.
2) ALL TIME HIGH breakout in monthly.
3) Primary trend will act as a resistance / profit booking zone in the long term at (Price 393).
4) Recommendation - Strong buy

Exideind"Breakout above 300 on both weekly and daily timeframes:
1) Initial breakout.
2) Second retest and subsequent breakout.
Now, the target is double the resistance of 300.
The first target is 600.

Flag & Poll Pattern Flag & Poll Pattern
EXIDEIND
+ Great prior uptrend with volume
+ Low Volume Halt
+ Above Key EMAs
-: Not a Buying recommendation
EXIDEIND - Long Setup, Move is ON..NSE:EXIDEIND
✅ #EXIDEIND trading above Resistance of 415
✅ Next Resistance is at 527
Related charts:
Charts are self-explanatory. Levels of breakout, possible up-moves (where stock may find resistances) and support (close below which, setup will be invalidated) are clearly defined.
Disclaimer: This is for demonstration and educational purpose only. This is not buying or selling recommendations. I am not SEBI registered. Please consult your financial advisor before taking any trade.

Exide industries: Pennant consolidation - Breakout watch
Strong Upward Momentum: Exide Industries has been experiencing a significant price increase, indicating strong investor interest.
Heavy Volume Surge: Trading volume has spiked over the past 10 days, suggesting increased buying activity and potential for a breakout.
Rising Delivery Volume: The rising delivery percentage signifies that trades are being settled with actual stock transfers, further emphasizing buying conviction.
Pennant Consolidation Pattern: The stock appears to be undergoing a pennant consolidation, a bullish continuation pattern that often precedes another price surge.
Strategic Partnerships Fuel Investor Buzz: Recent alliances with renowned automakers have boosted investor confidence in Exide's future prospects.
This analysis suggests that Exide Industries could be poised for a significant price increase. Investors interested in capitalizing on this potential opportunity should closely monitor the stock's price action and trading volume.
Disclaimer: I am not a financial advisor and this is not financial advice. Please consult with a qualified financial professional before making any investment decisions.

EXIDEINDEXIDEIND:- Stock has given breakout after 6 years, volumes are also good
Hello traders,
As always, simple and neat charts so everyone can understand and not make it too complicated.
rest details mentioned in the chart.
will be posting more such ideas like this. Until that, like share and follow :)
check my other ideas to get to know about all the successful trades based on price action.
Thanks,
Ajay.
keep learning and keep earning.

Exide Industries Ltd - Breakout Setup, Move is ON...#EXIDEIND trading above Resistance of 415
Next Resistance is at 527
Support is at 304
Here are previous charts:
Chart is self explanatory. Levels of breakout, possible up-moves (where stock may find resistances) and support (close below which, setup will be invalidated) are clearly defined.
Disclaimer: This is for demonstration and educational purpose only. This is not buying or selling recommendations. I am not SEBI registered. Please consult your financial advisor before taking any trade.

Exide Industries Ltd - Long Setup, Move is ON...#EXIDEIND trading above Resistance of 304
Next Resistance is at 415
Support is at 235
Here are previous charts:
Chart is self explanatory. Levels of breakout, possible up-moves (where stock may find resistances) and support (close below which, setup will be invalidated) are clearly defined.
Disclaimer: This is for demonstration and educational purpose only. This is not buying or selling recommendations. I am not SEBI registered. Please consult your financial advisor before taking any trade.

EXIDE IND 1HREARN WITH ME DAILY 10K-20K
EXIDE IND Looking good for Downside..
When it break level 449 and sustain.. it will go Downside...
SELL @449
Target
1st 442
2ND 435
EXIDE IND APR FUT – 3 LOT (Qty-10800)
MINIMUM 10L CAPITAL
Enjoy trading traders.. Keep add this STOCK in your watch list..
Big Investor are welcome..

Exide- Broke up to ExciteRounding bottom breakout done on weekly and monthly. Based upon the candle formation happened in 2 days, there are chances of retracing to 354 which is the breakout zone by next week before flying to the desired target mentioned in the chart.
Disclaimer:
Stocks-n-Trends is NOT a SEBI registered company. We do not provide Buy / Sell recommendations - rather we provide detailed analysis of how to review a chart, explain multi--timeframe views purely for Educational Purposes. We strongly suggest our followers to "Learn to Ride the Tide" and consult your Financial Advisors before taking any positions.
If you like our detailed analysis, please do rate us with your Likes, Boost and share your comments
-Team Stocks-n-Trends

Exide Industry Weekly Analysis CMP - 176 buy for Target 204-Exide Industry Weekly Analysis
CMP - 176
buy for Target 204- 219- 245-266 -289-305
