FDC trade ideas
Buy FDCAbout Stock: FDC is a SmallCap company with a market cap of ₹5,683 cr. It is a pharmaceutical company engaged in manufacture of specialized formulations, and oral rehydration salts (ORS).
Trade Setup: On Nov 6, stock has taken support at 89 SMA. It is also trading avove 200 SMA. Momentum Indicator RSI has turned direction and an early entry around 332-335 will give an edge.
Buy Zone: 332-335
SL: StopLoss - 314, Trail 1:1
Target: Target1=342, Target2=351 Target 3=380
Imp:
1. Trading requires more than technical analysis. e.g. Risk Management, trade management, psychology etc.
2. Always follow stop loss.
3. Once a trade is in your direction (say) 2-3%, never let it go in a loss.
4. Simply follow rules. Nothing else..
Disclaimer: This is for demonstration and educational purpose only.
Buy FDC - Quality midcap pharma, for 30% upside Buy FDC at current levels of 290-300, as it has given a breakout of Inverse H&S pattern on weekly chart, that results in target of Rs390-400.
Moreover the stock has given closing at highest levels on weekly & monthly charts, with very good volumes.
FDC has been performing very well on growth and profitability. Further, the co has over 700cr surplus cash on books.
Last year it had done a buyback at Rs350/ share.
FDC: A stock for the watch list A pharma company near its ATH looks interesting as fundamentals seem good. WIth a market cap of less than 5000 crores, and sales to market cap of 3x... the runway is long.
It has broken out of a 6 week consolidation zone and demand seems good though RSI is not yet supporting. There is overhead supply as it approaches all time high. So keep this in the watchlist.
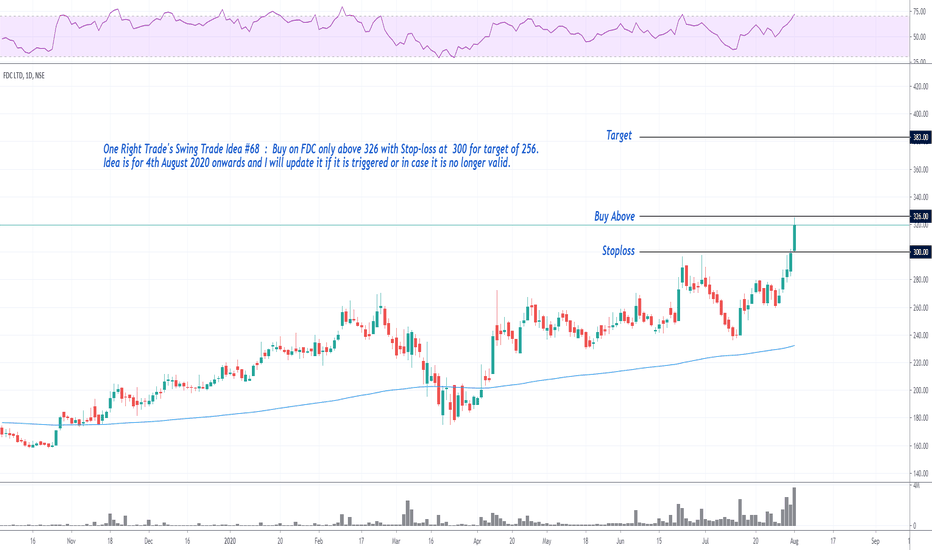
One Right Trade's Swing Trade Idea #68 : Buy on FDCPlease do like and share the idea in case you find it good and follow it for further updates on it for benefit of everyone. Also, please comment if you have any feedback. This idea by one right trade is only for study purpose and is not a trading call.
Bingo!!This is bullish on all TF
Notice how monthly candle is formed. It dipped down and surged all the way up which indicates buy orders were absorbed at that area. Why that area is important? Because on the left we can see how this stock tanked from that same area. Monthly candle has closed above all the candles to the left. It is a nice breakout on weekly and daily TF.
As per my knowledge it is fundamentally strong.
Breakout from a Consolidation Base - FDCFDC manufactures allopathic pharmaceutical preparations. The company operates in manufacturing and marketing of oral re hydration salts (ORS) and ophthalmics. The company has also set-up globally approved, multi-location manufacturing facilities for active pharmaceuticals ingredients (APIs) as well as finished dosage forms.
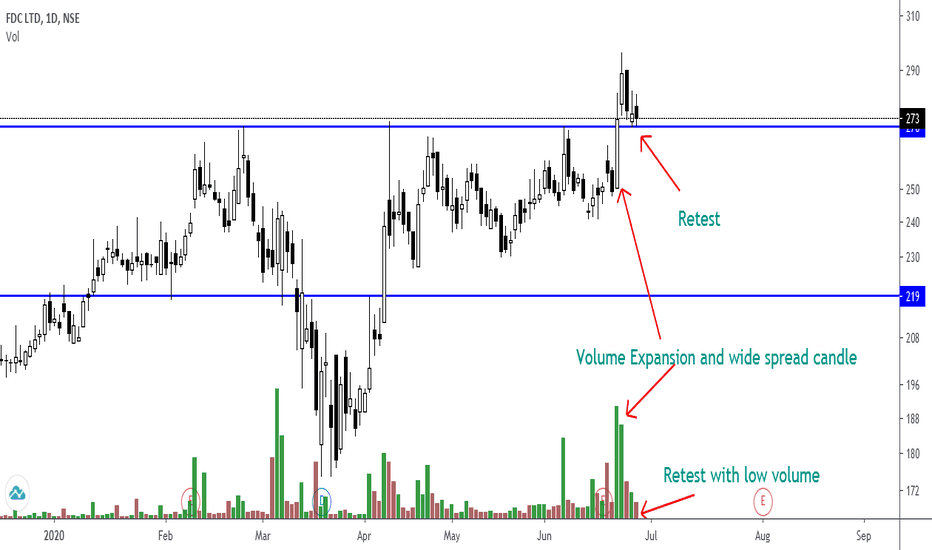
The stock broke out of a consolidation base on very good volume and is trading in an ideal buy zone. The key level of trend is at 241 and the critical level at 230. The stock has witnessed minor selling pressure and has found support near its previous high at 272. The ideal entry zone is between 272 and 285. With an invalidation level of 248 the stock has a potential to move towards the zone of 326 and 338.
Disclaimer
All investments involve risk, and the past performance of a security, industry, sector, market, financial product, trading strategy, or individual’s trading does not guarantee future results or returns. Investors are fully responsible for any investment decisions they make. Such decisions should be based solely on an evaluation of their financial circumstances, investment objectives, risk tolerance, and liquidity needs.


