FEDERALBNK trade ideas


Federal bank longIf It break 60 with volume then next target is 65 may be in next month. Open interest at 60 is high in this month series.

Buy Federal Bank for 25% upside, forming Inv H&S, Tgt 60Federal Bank is currently forming its Right shoulder in the bullish Inverse H&S pattern and will breakout above 50.7 (neckline). Buy at current levels of 46.5-47, for upside of 25-27% with target Rs60. SL at 44.7.


sell federal bank tmrw -intraday view feceral bank is now over bought , sell it in 15mins time frame chart

FEDERAL BANK Trading SetupDisclaimer: All charts are purely for educational and information purpose only. Invest or Trade at your own risk.

FEDERALBNK | Demand Zone + RSI bullish divergenceAfter huge selling pressure i'm seeing the price is taking some support with RSI divergence.
CMP : 49.80
SL : 48.40
Target : 54.30
1:3 risk reward setup

Federal Bank EW Analysis.This chart is for Education purposes only.
The chart is self explanatory. Ill add further comments as the trade progresses.


Gann Time & Price SymmetryWhile it’s not always clear why a time and price symmetry identified a market turn, such symmetries do indeed exist.Gann , considered the squaring of price and time his most important discovery . He called it Price & time squared.However, the proper application can be tricky.
Markets are enigmas, and this attribute demands a great deal of flexibility when working with price and time studies.
This is just another example of how Gann’s principle of time and price balance out.
What should be understood about this mystery is it does not materialize every day. However, when it does, it usually leads to a powerful trend,
As hard as this analytical sleuthing appears, the rewards are worth the effort. All the trader needs is to find one key calculation on an important chart and leverage it out to the overall market.
Gann and several generations of traders have used time and price analysis successfully. You can spend a lot of time figuring out where a market is going to turn based on certain symmetries. It’s best to have a rough idea without spending too much time looking for a move that is not there.
Before attempting trade entry, you need an edge that gives you confidence that you are on the right side of the market. Once that is established, you can use your own rules and discipline to find good entries. Gann will help and square roots certainly are an important piece of the puzzle.
As you perform your due diligence, you might find something else, such as a specific date matching up with the range. Opportunities are out there. There might be something vitally important sitting just below the surface of your price charts. Gann time and price analysis and square roots can get you there.


FEDERAL BANK MOVING IN A TRENDPossible support and resistances are given, place targets and stop losses accordingly.
Trade in the range or wait for a breakout below the range.

federal Bank has a huge chance todayFEDERAL BANK is in its common support and resistance line. There may an uptrend or a downtrend in the start of the day and then it may follow it. Here the MACD and Moving Average has shown a crossover in the 15 mins period, so credibly an uptrend may occur.


Again FEDRALBNK is an good opportunity for easy Money Buy @43THIS Bank has huge capital investors and along with Foreign account holders it will be the biggest benificary in this PSUbank rally buy at cmp @43/44 for below Targets
1st Target 48
2nd Target 55
3rd Target 60 withing two weeks spam

Federal Bank - Small Bearish DivergenceFederal bank has taken support from the trend line shown and is sitting almost on it now.
The stock is showing a hint of bearish divergence which has been confirmed with the 2 downward movements on Thursday and Friday. It could very well have served the function of consolidation for large volume buying happening during the uptrend.
52 is a key level to watch for bearish breakout.
If it falls below 52 - closes below 52 on the 15 minute candle; Short trades can be initiated for targets of 51 and 50 with SL at 53.
The stock would be bullish above 54.5 indicating consolidation is complete and its open for new heights. Long trades can be initiated for targets of 56, 57, and beyond.
Behaviour of BANK NIFTY will affect the movements here so keep an eye out.
In case of Gap openings below and above the last 2 sessions high and low levels, exercise caution in taking short and long trades respectively.

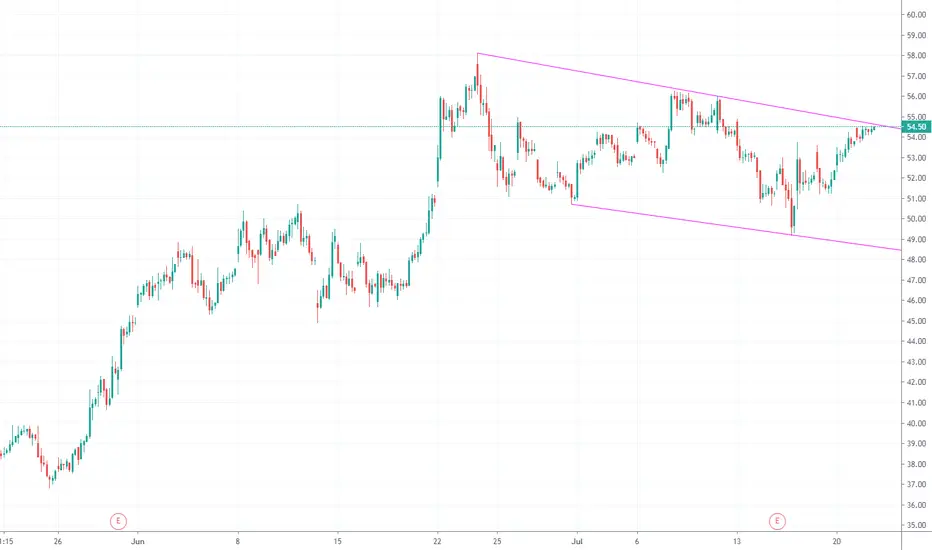
FEDERAL BANK: TRADE PLAN 06 JUL ONWARDSLevels as mentioned on the chart
Views are for ‘’EDUCATIONAL PURPOSE ONLY’’ trade at your own risk.
"Always Respect Risk"
Happy Trading
Jai Hind,Jai Bharat

Federak Bank LongSeeing good support at daily channel support + breaking trendline with bullish candle at major supply-demand zone.
