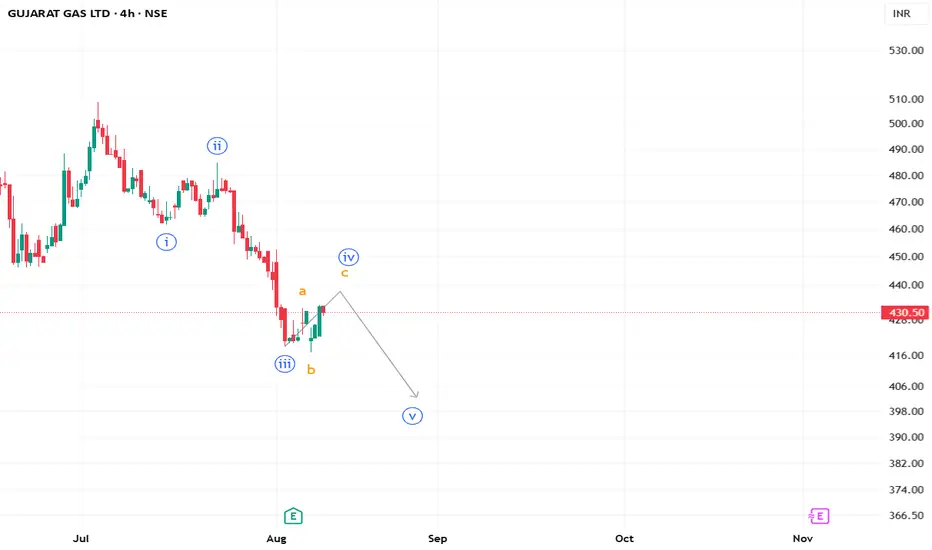
#Gujgasltd Elliott Wave Count Signals Potential Final Leg LowerBased on the 4-hour Elliott Wave analysis, Gujarat Gas appears to be in the final stages of a corrective Wave iv within a larger downtrend. The current price action suggests completion of an A-B-C structure for Wave iv, with the “c” wave nearing its top. If the count holds, the stock may soon resume
Next report date
—
Report period
—
EPS estimate
—
Revenue estimate
—
16.65 INR
11.48 B INR
164.87 B INR
172.26 M
About Gujarat Gas Ltd.
Sector
Industry
CEO
Milind Shivaram Torawane
Website
Headquarters
Gandhinagar
Founded
1989
ISIN
INE844O01030
FIGI
BBG00B06V5K3
Gujarat Gas Ltd. engages in the distribution of natural gas. Its businesses include Piped Natural Gas-Domestic, Piped Natural Gas-Industrial, Piped Natural Gas-Commercial, Compressed Natural Gas, and HAPi pipeline. The company was founded in 1989 and is headquartered in Ahmedabad, India.
Related stocks
Gujarat Gas Limited (GUJGASLTD)Gujarat Gas Limited (GGL) is India’s largest city gas distribution (CGD) company, operating under the administrative control of Gujarat State Petroleum Corporation (GSPC). It is listed on the NSE (GUJGASLTD) and BSE (539336) and serves residential, industrial, commercial, and vehicular consumers acr

Gujarat Gas
The price has broken through a resistance level following strong buying activity, after shakeout.
- Entry Price: ₹500.Stop Loss:System Stop Loss: Set at 10% below entry, i.e., ₹450 (₹500 - ₹50).
- Risk Tolerance: Maximum risk capped at 8% (₹40), which corresponds to a price of ₹460.
- Manual Exi

Technical Analysis of Gujarat Gas Ltd. (GUJGASLTD)
Background:
Gujarat Gas Limited is a natural gas distribution company in India.
Technical Analysis:
Trend Analysis:
The overall trend for Gujarat Gas Ltd. appears to be bullish. The stock has been consistently making higher highs and higher lows, indicating a strong uptrend.
Key Technical Indicator

Keep an eye on #GUJGASLTDKeep an eye on #GUJGASLTD
Took support at level of 600, moving up with a big green candle after a good fall
on daily chart ..

GUJARAT GAS Inside Candle Pattern Near Key Resistance
✅ The stock has formed an inside candle pattern near the 700 resistance level. This pattern suggests consolidation before a potential breakout. The price is also supported by an upward trendline.
✅ RSI is at 66, showing bullish momentum with room to move higher if the breakout occurs.
✅ A confir

Reason Behind the successful trade of ten percent gap up in the I Was Looking In The weekly time frame but unknowingly the price was at the bottom of triangle so the next morning after the taking trade price gapped up 10% so from the loss of few thousand it turn to be 75000 positive side.

GUJGASLTD - VCP Chart Pattern BreakoutGUJGASLTD - GUJARAT GAS LTD
~ CMP - 680
~VCP chart pattern breakout with strong volume
~Expecting a quick rally towards 800 in few days
~ Trade Type - Short Term ( 1 month to 2 month)
~ Target 1 - 725
~Target 2 - 780

Gujarat Gas Ltd (NSE: GUJGASLTD) Stock Chart Analysis
Analysis of Gujarat Gas Ltd (NSE: GUJGASLTD) Stock Chart
The image shows the daily price chart of Gujarat Gas Ltd (GUJGASLTD) on the National Stock Exchange (NSE). Below is an analysis based on the visible patterns and key levels:
1. Current Price and Movement:
Current Price: ₹680.00
Price Chan

GUJGAS - Cup and Handle Breakout and retested -WklyGUJGAS - Cup and Handle Breakout and Retested-Wkly
Name - GUJGASLTD
Pattern - Cup and Handle
Timeframe - Wkly
Status - Breakout and retested
Volume - Very Good
Cmp - 680
Target - 784
SL - 593
Pattern: Cup and Handle
The Cup and Handle pattern is a bullish continuation pattern

See all ideas
Summarizing what the indicators are suggesting.
Neutral
SellBuy
Strong sellStrong buy
Strong sellSellNeutralBuyStrong buy
Neutral
SellBuy
Strong sellStrong buy
Strong sellSellNeutralBuyStrong buy
Neutral
SellBuy
Strong sellStrong buy
Strong sellSellNeutralBuyStrong buy
An aggregate view of professional's ratings.
Neutral
SellBuy
Strong sellStrong buy
Strong sellSellNeutralBuyStrong buy
Neutral
SellBuy
Strong sellStrong buy
Strong sellSellNeutralBuyStrong buy
Neutral
SellBuy
Strong sellStrong buy
Strong sellSellNeutralBuyStrong buy
Displays a symbol's price movements over previous years to identify recurring trends.
Frequently Asked Questions
The current price of GUJGASLTD is 420.45 INR — it has decreased by −0.08% in the past 24 hours. Watch Gujarat Gas Ltd. stock price performance more closely on the chart.
Depending on the exchange, the stock ticker may vary. For instance, on BSE exchange Gujarat Gas Ltd. stocks are traded under the ticker GUJGASLTD.
GUJGASLTD stock has fallen by −3.78% compared to the previous week, the month change is a −5.73% fall, over the last year Gujarat Gas Ltd. has showed a −28.58% decrease.
We've gathered analysts' opinions on Gujarat Gas Ltd. future price: according to them, GUJGASLTD price has a max estimate of 600.00 INR and a min estimate of 350.00 INR. Watch GUJGASLTD chart and read a more detailed Gujarat Gas Ltd. stock forecast: see what analysts think of Gujarat Gas Ltd. and suggest that you do with its stocks.
GUJGASLTD reached its all-time high on Sep 2, 2024 with the price of 689.45 INR, and its all-time low was 360.60 INR and was reached on Mar 3, 2025. View more price dynamics on GUJGASLTD chart.
See other stocks reaching their highest and lowest prices.
See other stocks reaching their highest and lowest prices.
GUJGASLTD stock is 1.77% volatile and has beta coefficient of 1.33. Track Gujarat Gas Ltd. stock price on the chart and check out the list of the most volatile stocks — is Gujarat Gas Ltd. there?
Today Gujarat Gas Ltd. has the market capitalization of 289.05 B, it has decreased by −0.94% over the last week.
Yes, you can track Gujarat Gas Ltd. financials in yearly and quarterly reports right on TradingView.
Gujarat Gas Ltd. is going to release the next earnings report on Nov 7, 2025. Keep track of upcoming events with our Earnings Calendar.
GUJGASLTD earnings for the last quarter are 4.70 INR per share, whereas the estimation was 4.62 INR resulting in a 1.82% surprise. The estimated earnings for the next quarter are 4.17 INR per share. See more details about Gujarat Gas Ltd. earnings.
Gujarat Gas Ltd. revenue for the last quarter amounts to 38.71 B INR, despite the estimated figure of 39.90 B INR. In the next quarter, revenue is expected to reach 37.37 B INR.
GUJGASLTD net income for the last quarter is 3.28 B INR, while the quarter before that showed 2.88 B INR of net income which accounts for 13.81% change. Track more Gujarat Gas Ltd. financial stats to get the full picture.
Yes, GUJGASLTD dividends are paid annually. The last dividend per share was 5.82 INR. As of today, Dividend Yield (TTM)% is 1.39%. Tracking Gujarat Gas Ltd. dividends might help you take more informed decisions.
Gujarat Gas Ltd. dividend yield was 1.41% in 2024, and payout ratio reached 34.89%. The year before the numbers were 1.04% and 34.07% correspondingly. See high-dividend stocks and find more opportunities for your portfolio.
As of Oct 17, 2025, the company has 953 employees. See our rating of the largest employees — is Gujarat Gas Ltd. on this list?
EBITDA measures a company's operating performance, its growth signifies an improvement in the efficiency of a company. Gujarat Gas Ltd. EBITDA is 18.64 B INR, and current EBITDA margin is 11.79%. See more stats in Gujarat Gas Ltd. financial statements.
Like other stocks, GUJGASLTD shares are traded on stock exchanges, e.g. Nasdaq, Nyse, Euronext, and the easiest way to buy them is through an online stock broker. To do this, you need to open an account and follow a broker's procedures, then start trading. You can trade Gujarat Gas Ltd. stock right from TradingView charts — choose your broker and connect to your account.
Investing in stocks requires a comprehensive research: you should carefully study all the available data, e.g. company's financials, related news, and its technical analysis. So Gujarat Gas Ltd. technincal analysis shows the strong sell today, and its 1 week rating is strong sell. Since market conditions are prone to changes, it's worth looking a bit further into the future — according to the 1 month rating Gujarat Gas Ltd. stock shows the strong sell signal. See more of Gujarat Gas Ltd. technicals for a more comprehensive analysis.
If you're still not sure, try looking for inspiration in our curated watchlists.
If you're still not sure, try looking for inspiration in our curated watchlists.