HAVELLS LONGI hope you can now see how HAVELLS represents an excellent low risk profit entry setup allowing you to trade in the market.Take positions so that the risk/reward is in your favor.
Knowing why, where & when a strong reversal signal is being generated will be the only way to capitalize on your technical analysis .
Disclaimer: It should not be assumed that the methods, techniques, or indicators presented in these chart will be profitable or that they will not result in losses. There is no assurance that the strategies and methods presented will be successful for you. Past results are not necessarily indicative of future results. You should not trade with money that you cannot afford to lose. Examples presented in these charts are for educational purposes only and it should not be assumed that these are indicative of ordinary trades. These setups are not solicitations of any order to buy or sell. The publisher assume no responsibility for your trading results. There is a high degree of risk in trading.
HAVELLS trade ideas

Havells ShortI hope you can now see how Havells represents an excellent low risk profit entry setup allowing you to trade in the market.Take positions so that the risk/reward is in your favor.
Knowing why, where & when a strong reversal signal is being generated will be the only way to capitalize on your technical analysis .
Disclaimer: It should not be assumed that the methods, techniques, or indicators presented in these chart will be profitable or that they will not result in losses. There is no assurance that the strategies and methods presented will be successful for you. Past results are not necessarily indicative of future results. You should not trade with money that you cannot afford to lose. Examples presented in these charts are for educational purposes only and it should not be assumed that these are indicative of ordinary trades. These setups are not solicitations of any order to buy or sell. The publisher assume no responsibility for your trading results. There is a high degree of risk in trading.


Long Oppurtunity in HavellsHavells has broken out of head and shoulders pattern on a daily time frame chart. Upside targets of 15% possible after the clear breakout from the neckline. Targets and stop are indicated on chart.


NSE:HAVELLS support broken and started fallingNSE:HAVELLS
#NSE:HAVELLS shared yesterday in TV with the levels, as mentioned, support broken and it started falling.
our 1400 PE trading with 10k profit till now !!
Check out the attached idea shared yesterday !!

NSE:HAVELLS trading above the TL and reached to levelNSE:HAVELLS
#NSE:HAVELLS trading @ the Trend line, high chances to fall if the support broken !!


Havells Havells looking good structure for intraday or swing trading
Keep watch on Havells it can give a good move
This is only for education purpose

RSI, Time CycleHavells could be sell near 17Nov2021 or 18Nov2021. Target date to cover position would be 8Dec2021.

Simple Trade Setup | HAVELLS | 15-11-2021 [INTRADAY]NSE:HAVELLS
Observations:
1) On Daily time frame, It gave breakout of 1360 level and closed above it.
But it faces resistance from 50DMA.
One positive thing is that it is trading above 21DMA.
50DMA is placed at 1378.06 and 21DMA is palced at 1334.04
Please refer below chart : 1 day Time Frame.
-------------------------------------
Trade Setup for Date: 15-11-2021
1) Don't Jump in to trade at the beginning of the market. Let it get settle for 15-20min first and judge the price action.
2) Everything is mentioned on the chart. I hope it is easy to understand.
3) All the levels will work as support, resistance, entry and exit w.r.t price action near that level.
4) Avoid gap up or gap down chase. Wait and trade between levels.
Please refer below chart for levels.
Hope I made it easy to understand it.
Do comment your doubt or suggestion.
Note: Trade with Strict SL. It may or may not hit all the levels. So one can book profit / loss at respective level considering how price action works near that level.

HAVELLS LongPrices are on recovery retracement mode for a retest of 1450 level
All Levels Mentioned On Chart
How to trade the setup?
When the chart says Long or Short at particular level, Put a Stop Order at those levels, Levels are strict
T1 : is Target 1
T2 : is Target 2
When you achieve your first target, book profits of 50%
and shift the stops to the cost
The term Catastrophe Stop, is a maximum movement of price that can happen in opposite direction of trade
so that the setup remains valid, Its basically used, to give some breathing space to the trade,
I may call for a recovery if the setup becomes invalid as the market progress.
As we all know anything can happen in the market and we should respect that
The Idea is for Educational purpose only
At Last, do your own analysis, before trading your money!

Havells is trading inside box.Havells can be seen for positional buy but after box breakout or breakdown.

Havells at good support levelHavells previous resistance area can become good support zone here and probability is to give a good move from here


HAVELLS in FnO long HAVELLS in FnO above 1300 to for target 1375 Stop loss 1250
risk:reward 1:1.5
hedge your futures position


HavellsYou can go long on Havells as it has come back to test its previous resistance which have become support now.


#HAVELLSSimple ways to exit helps you protect your capital
Here 1453.20 was the ISL which was executed after a minor HH and sudden SC formed later
A retest was done with another LH which was the last point for sell after the overlap
Simple and effective, maintain your portfolio at the peaks.
Later W CCI crossed below 100 and stock does 1210 from 1504 high in 4 days!
Being Alert is the only key.

Simple Trade Setup | HAVELLS | 25-10-2021 [INTRADAY]NSE:HAVELLS
Observations:
1) On daily time, it is stucked between 50DMA and 100DMA.
Good thing is that it took support from 100DMA.
On 22 Oct it made doji candle and also gave close above 1280 level which was earlier resistance and breakout level.
If it maintain above 1280 level then this level will be now support level and we can see bounce back from this level.
Please refer below chart : 1day Time Frame.
2) On 15min time frame, we can see bullish divergence. As price is making alomst flat lows while RSI is making higher lows.
Please refer below chart : 15min Time Frame.
-------------------------------------
Trade Setup for Date 25-10-2021:
1) Don't Jump in to trade at the beginning of the market. Let it get settle for 15-20min first and judge the price action.
2) Everything is mentioned on the chart. I hope it is easy to understand.
3) All the levels will work as support, resistance, entry and exit w.r.t price action near that level.
4) Avoid gap up or gap down chase. Wait and trade between levels.
Please refer below chart for levels.
Hope I made it easy to understand it.
Do comment your doubt or suggestion.
Note: Trade with Strict SL. It may or may not hit all the levels. So one can book profit / loss at respective level considering how price action works near that level.

Ascending triangle pattern in havellsAscending triangle pattern
Stock near 20 dma high.
Good volume green candle.
Near horizontal resistance breakout.
Buy above 1483 for target of 8 to 10 percent.
Stoploss is below last good volume green candle.
Risky people can put sl below 20 dma low.
This is only for education purpose.

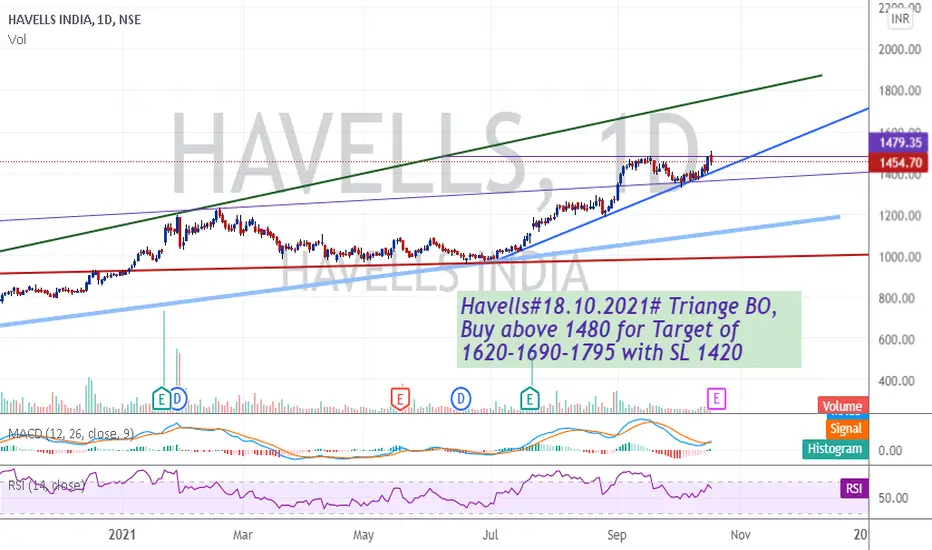
Triangle Break Out #Havells# Upward Triangle Break out # on Havells Daily chart. Good support of trend line buy and hold for short term with a superb upside Don't miss this opportunity