Havells - LONGHavells at previous 6 Month support level. On a hourly time frame a triangle has formed , Once it gives breakout we can enter at these levels.Longby priceNpedia0
HavellsPrice action is at resistance zone. Trend direction will be decided in few days.by vanathiUpdated 1123
Havells India Trend Analysis & Trade setup !!TREND ANALYSIS Trade Setup Follow Chart Instruction. Do not be Hurry for entry. Wait for Proper Entry Setup. Buy/Sell with Best Risk Reward. Educational Chart Only. You can Comment and ask the TREND ANALYSIS of any STOCK/SCRIPT/INDEX/FOREX. R:R is 4-8 timesLongby MohitAroraUpdated 113
Above 685 target 715, If below 625 target 580Above 685 target 715, If below 625 target 580Shortby ajayjetty0
#HAVELLS CASH : ALL SELLING ONLY BELOW 665 LEVELS#HAVELLS CASH 16 SEPT 2019 ALL SELLING IN HAVELLS CASH ONLY BELOW 665 STOPLOSS 672 TARGET 656/648 AND BELOW CMP 671.80Shortby anandnst3
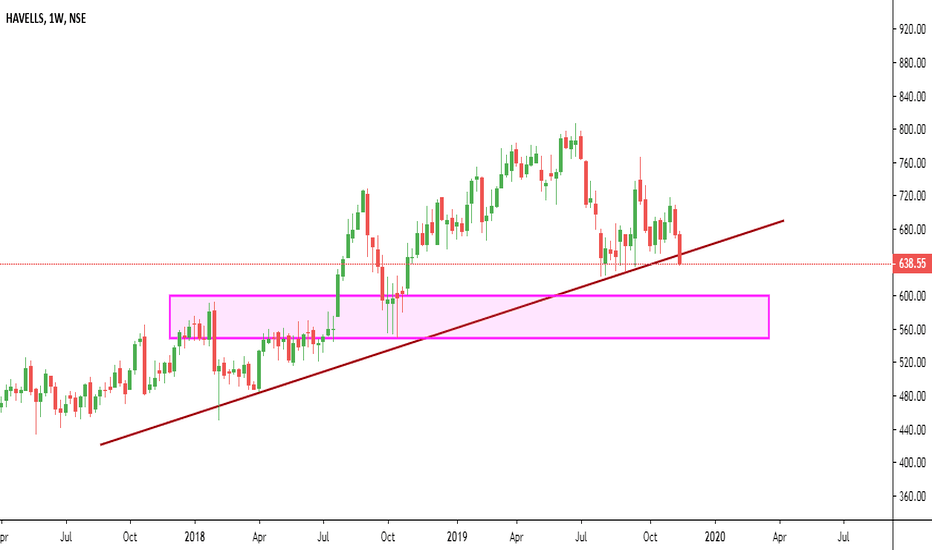
Havells 620 Trendline Support, One-Side BreakoutHavells (weekly) view: good as far as Havells stock holds 620 + level. Staying below 620 - level, weak.by BreakoutStocksUpdated 0
Havells Weekly- Trading in a tight cluster between Havells Weekly- Trading in a tight cluster between EMA'S, historically it bouncedLongby priceaction_1360
HAVELLS LTD 4H CHARTFlag Pattern Formed. Case-1 Long above 673.25 Targets are 680.25,681.3,684,685.4,686.7,693.95++ SL-666 Case-2 Short below 666 Targets are 664,661.1,656,655.05,652.1-- SL-673 by SaiKarthik241
HAVELLS Inside Bar TradeLong if it breaks the high of the previous day with a stop loss at the previous day's low. Short if it breaks the low of the previous day with a stop loss at the previous day's high. In case of gap up above the previous day's high or gap down below the previous day's low, please avoid buying it or selling it respectively. Follow the ending of the candle formed in first 5 minutes and follow ORB strategy. by unofficed1
Bullish Alt Shark - Havells - 4Hr Bullish Alt Shark - Havells - 4Hr PRZ: 623-625Longby HarmonicsInAction0