#HCLTECH Low Risk LongsWith the slight upturn in Ratio Charts of Nifty IT/Nifty. This stock is a good LRL.
HCLTECH trade ideas

HCL tech multi timeframe analysis for swing trading in hindiHCL tech multi timeframe analysis for swing trading in hindi
in this video i have shown, 15 minutes & daily chart analysis of HCL tech.
and trade setup for next day 08/08/2022.
you will get idea of where to short sell & where to put stop loss.
i have shown practical use of reversal pattern such as triple top, H&S, double top & rising wages pattern.
i have also discussed about trendline, RSI diveregence & wyckoff method in real life example.
basically i have shown, how to use technical analysis in real life.
video is in hindi language.
if you like or found useful, kindly like, subscribe & share.
Disclaimer: only for learning, not trading tip. trade at your own risk.
Hindi description:
Swing trading k liye HCL tech ka multi timeframe analyis.
maine is video me bataya hai k kaise trendline,reversal pattern aur RSI ka istemal real life me kaise kiya jata hai.
is video me aap sikhenge ki double top/ triple top/ H&S ko kaise real chart par mark kiya jata.
is video se aap technical analysis ko sahi tarike se use karna sikhenge.
disclaimer: yah keval learning k liye banaya aur share kiya gaya hai, trade apne risk par kare

HCL Tech - Trendline BreakHCL Tech has broken the Trend line in Daily Time frame.
Buy above 970
SL 925
1st Target 1070 and 1090 is 2nd Target.
Thanks

HCL TECH AnalysisVolume is supporting the Price movement in a Weekly basis.
On daily Price decreased but Volume also decreased.
Stuck on Symmeterric Triangle.
Inside bar pattern formed.
Will wait for either side to Breakout.

HCLTECH | TRENDLINE BREAKOUT | 1:1.8 RRPOINTS TO NOTE:
______________________________
1. Stock is in a minor uptrend forming Higher Highs and Lows
2. Price is near support.
3. It has broken out of a downwards trendline.
A long can be initiated as follows:
Entry above 961.8
SL 952.6
Targets of 978, 986
RR 1:1.77
As always, keep your trades within your risk appetite. And always enter SL first.


HCL TECHmake long position in HCL tech if crosses 962 level for target of 985 , 1005 and 1040. with stop loss of 950

HCL TECH;LONG SWING TRADEHCL TECH;go long safe trade hold it for 2 months for quick 10 to 15 percent gain ; play safe ; safe trade ; fundamentally strong stock ; dont run for penny stocks

Price Action Day time BreakoutHCL Day Chart.
1. Trading at PRZ (925-952 - A good accumulation zone.
2. Historical support level 924 nearby.
3. Potential Breakout level is 1013 day closing basic
First Target - 1013
Last target - 1174
happy trading....////////

HCL buy trade with 1/2 of usual riskHCL has just given a breakout in 1d time frame...here we can trade for 1:5 risk to reward...after a long downfall, HCL has gained momentum

Keep Watch on HCL TECH !!If see on 1 day chart its in downward parallel trend , where's inside it is going to bullish.
Keep Watch and enter, its going to mostly bullish as RSI is also showing upward,
UP - 65%
Down - 35%
TF: 15 mins

#Hcltech cash : Looks good above 955.10#Hcltech cash -Positional call
28.07.2022
Looks good buy above 955.10
Stoploss 933
Target 995-1000
Cmp 946.10


HCL TECH - Triangle BreakoutIf hcl tech breaks triangle then target will be 1200 and second target is 1300
Stop loss is - 870

HCL TECH LearningIn horly time-frame of Hcl Tech hammer pattern formed.
SL mentioned in chart.
1:1 target achieved.

Yearly Breakdown in HCLTECHHCLTECH has closed below 891 on daily time frame. This low was touched last year in May. The aggressive fall this week shows the bearish nature. Also the dividend payout may pull down the stock even further

HCLTech - Short - Target 920-915HCLTech has given triangle pattern breakdown, can see a target of 920-915 levels

HCLTECH trading @ Key Support !!NSE:HCLTECH
#NSE:HCLTECH trading @ Key Support level and good above 935 with as 925 SL.
Medium to long term, chances to continue fall if BD 890 level.
Happy LEarning !!

HCL : Time to accumulate HCL Weekly Chart.
1. Trading at PRZ (900-950) - A good accumulation zone.
2. Historical support level 900 nearby.
3. Potential Breakout level is 1,010.

HCL TECH --- INTRADAY SETUP -- 04/07/2022HCL TECH -- HOURLY CHART -- INTRADAY SETUP -- 04/07/2022
1. HCL tech seen trendline breakout last hourly candle on hourly chart
2. Stock seen 44 , 200 HMA support at bellow last hourly candle
3. stock trading near channel bottom support pullback can seen from this level
4. Histogram seen supply decrease at current level from oversold level , double bottom formation also can be seen .
5. BUY can initiate at intraday between 970-975 for target 980-985-990 with stop loss bellow trendline support at 960
6. support and resistance shown on chart by arrow mark
** THIS IDEA IS FOR EDUCATIONAL PURPOSE .. trade at own risk !
HAPPY TRADING !!


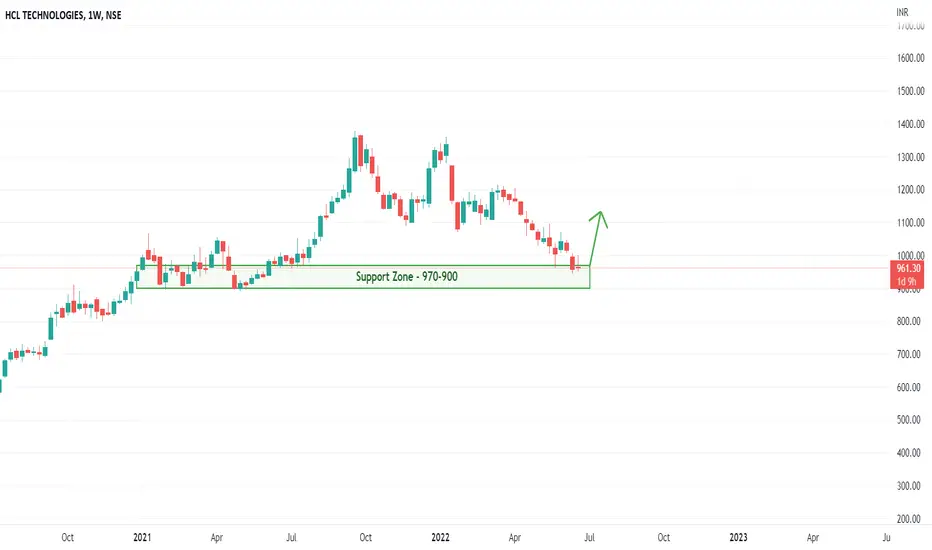
HCL TECH - 23rd June 2022Stock approaching its Medium Term Support Zone @ 970-900 Levels.
Value Investors can look to start accumulating the Stock at these Levels