HCL looks very bullish - buying opportunityHCL has very positive momentum
RSI above ~50
Forming a cup pattern, entry can be made between 1200-1222 level
Breakout already done, Re-test can be expected on support level 1200 which was pervious resistance.
Targets are mentioned in the chart and chart is self explanatory.
Great chart setup.
Disclaimer: This is for educational purpose, pls invest as per your analysis and risk-reward.
HCLTECH trade ideas

Bought 30% HCL Tech Bough HCL Tech
Reason:
1. Inverse Head and shoulder
Note- Don't follow my trade. This is only for education

Trendline and resistance breakout HCL Tech has given a trendline and resistance breakout
Stay tuned for a further up-move, can enter on a retest around 1190
Or, half the quantity around current level and other half if it retest

HCL SHARE TO XCLCLOSING above 1220 and IT sector breaking the previous pivot high and markets breaking 17000 is strict to buy...else it will only give a intraday rally and cool off if the market is not supportive.
ANCHORED vwap lines are those green colour lines and shows support and resistance
FOLLOW me for more such content ahead...Till then,
HAPPY TRADING :)

Buy above 1215 SL 1204 TGT 1227Suggestions are based on my analysis only. Please do your analysis before taking any trade.


buy HCLTECH
IHNS breakout done with volume
dips buy till 1190
SL 1140
breakout above 1220
TGT 1240 1260 1300

HCLTECH buy on daily #headandshoulderSwing Trade for HCLTECH................... you can go long with this stock for few weeks or days for positional or swing trades. Also company has good performance rate you can hold lifetime if it doesn't give any bad news about this company.


Buy Today Sell Tomorrow: HCLTECH for more than 3%HAVE A LOOK AT THE PAST PERFORMANCE ON THIS PAGE!
- Take BTST trades at 3:25 pm everyday
- Book profits within first 30 minutes of the market opening
- Try to exit taking 3-5% profit of each trade
- SL can be taken when 5/15 min candle close below 44EMA

HCLTECH inv h&s pattern resistance will it cross??chart is simple and self explanatory
resistance level pattern formation .
breakout sustain or fall
observe as posted for self learning and sharing to inhance technical analysis pattern.
market always risky confirm at ur end technical fundamentals
risk is ur decission is ur.


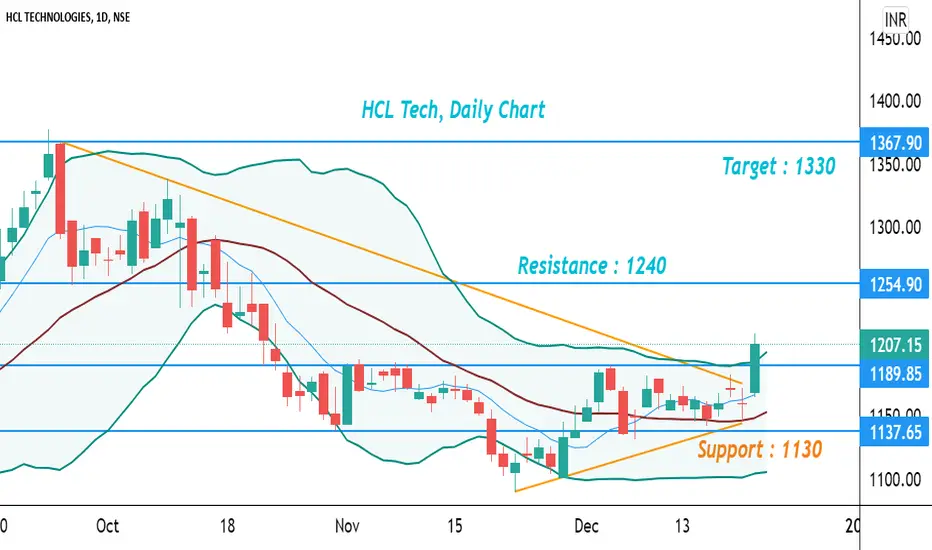
#HCLTech, Buy, Target 1330, SL 1120 The stock has provided a positive breakout and i expect the stock to test recent high in coming days. Kindly maintain strict Stop Loss.

Good swing and positional setup.Hey guys.
As you see HclTeach was in downtrend and now its breaking its trendline. Yesterday it took resistance from 50 period moving average but in daily timeframe you can see a clear inverse head and shoulder pattern so once it crossed its daily 50Ma and give closing up to 1200 as shown by the resistance line we can go for a swing trade of 5 percent and for positional target would be 12 percent. Manage your risk according to your risk appetite .

Inversed Head & Shoulders + EMA + S & RThe support has taken support at key level and trading above key moving averages.
Favourable risk & reward of 1:2 and entry, exit & stop loss mentioned in charts.
Thanks


HCLTECHThis stock has retraced approx 21% from its all time high and now has pulled back after retesting its support. Buy above 1190, TGT 8 to 10%. For educational purpose only.


HCLTECH important levels for long term investmentHCLTECH important levels for long term investment
Disclaimer: All charts are purely for educational and information purpose only. Invest or Trade at your own risk.

Downtrend breakout opportunity! GRAB it!Here's a possible downtrend breakout for the next trading day. Check for volume confirmation before entering the trade

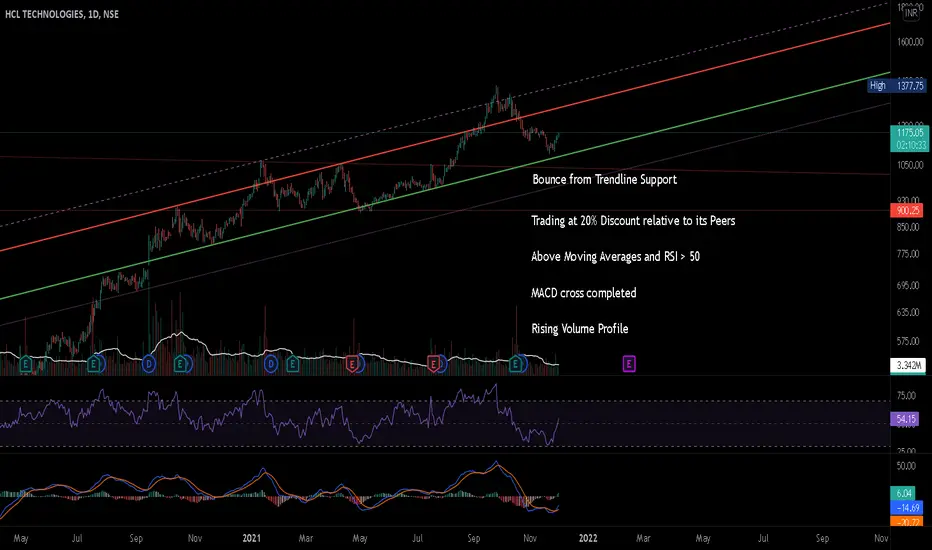
Trend Analysis - Bounce from SupportHCL Tech is one of the leading IT companies quite similar to Wipro and Infosys.
It seems it has reached the trendline support and shown a healthy bounce of 4% in 4 days
The share dragged because of lower than expected quarterly earnings and PE wise, it is trading at 27 while TCS, Infosys and Wipro are between 34-36 region.
TCS has made a similar pattern as well and it will be interesting to see how these 2 shares pan out in the coming days.
I don't expect any impulsive move but slow and steady upside move.
Buy at CMP for 10 to 15% returns.W pattern formed after correcting 18-20 %. Also volumes increased in last 2 days. Good stock buy from IT sector for short term.
