PCR Trading Strategies Option trading strategies are structured combinations of buying and/or selling options—calls and puts—sometimes along with the underlying asset, to achieve specific risk–reward objectives. Unlike simple stock trading, options allow traders to profit from price movement, time decay, volatility change
Next report date
—
Report period
—
EPS estimate
—
Revenue estimate
—
47.25 INR
707.92 B INR
4.75 T INR
15.36 B
About HDFC Bank Limited
Sector
Industry
CEO
Kapila Deshapriya
Website
Headquarters
Mumbai
Founded
1994
Identifiers
2
ISININE040A01034
HDFC Bank Limited (the Bank) is a holding company. The Bank offers a range of banking services covering commercial and investment banking on the wholesale side and transactional/branch banking on the retail side. It also offers financial services. The Bank's segments include Treasury, Retail banking, Wholesale banking and Other banking business. The Treasury segment primarily consists of net interest earnings from the Bank's investment portfolio, money market borrowing and lending, gains or losses on investment operations and on account of trading in foreign exchange and derivative contracts. The Retail Banking segment serves retail customers through a branch network and other delivery channels, as well as through alternative delivery channels. The Bank provides its corporate and institutional clients a range of commercial and transactional banking products. The Other banking business segment includes income from para banking activities.
Related stocks

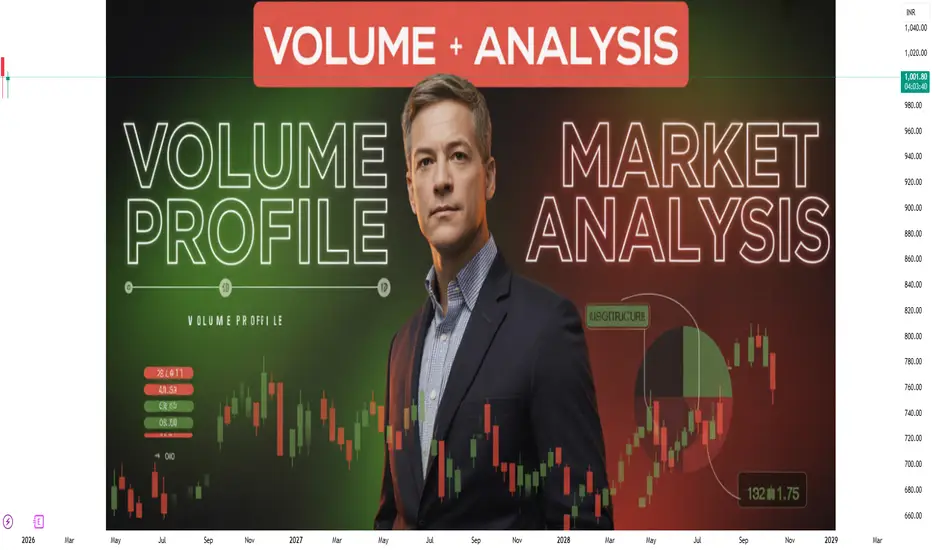
Volume Profile and Market Analysis: A Comprehensive Guide1. Introduction to Volume Profile
Volume Profile is a graphical representation that shows the amount of trading volume that occurred at specific price levels over a given period. Unlike standard volume indicators that display total volume per time period (bars or candles), Volume Profile organizes
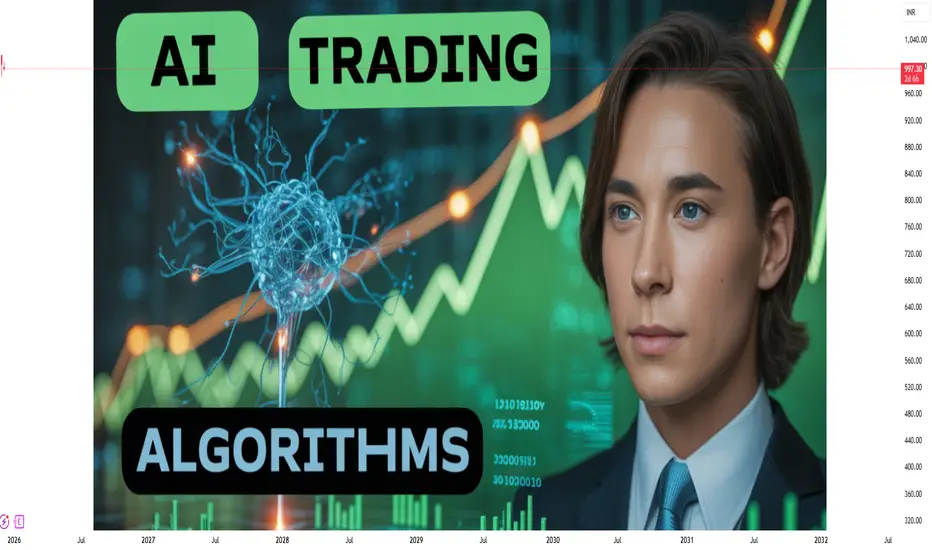
Algo, Quant & Data-Driven Trading1. What is Algorithmic Trading?
Algorithmic trading (algo trading) is the execution of trades automatically using pre-defined rules or instructions coded into a computer system. These rules may involve price, time, volume, technical indicators, or market conditions.
Key Characteristics of Algo Tra
Part 11 Trading Master Class Why Trade Options?
1. Leverage
A small premium controls a larger value of the underlying asset.
Example:
₹10,000 stock lot value vs. ₹500 premium.
2. Hedging
Used like insurance.
Example:
A portfolio hedge using puts protects from downturns.
3. Income Generation
Selling options, like covered

Option Trading Psychological Factors for Profit
a) Patience
Wait for setup confirmation.
b) Discipline
Follow risk rules.
c) Emotion Control
Avoid greed.
Book profits early.
d) Backtesting
Practice improves profitability.

Understanding the World’s Largest Financial MarketTrade with Forex Currency
Foreign Exchange trading, commonly known as Forex trading, is the process of buying one currency while simultaneously selling another with the aim of profiting from changes in exchange rates. It is the largest and most liquid financial market in the world, with trillions o

HDFCBANK 1 Day Time Frame 📌 Current Price Snapshot (recent data)
Approx. current price: ~₹995–₹1,002 on NSE intraday trading.
Day range seen recently: ~₹992–₹1,004.
📊 Daily Pivot / Support & Resistance Levels
🧮 Daily Pivot:
Pivot Point (PP): ~₹997-₹1,001
📈 Resistance Levels
R1: ~₹1,004-₹1,006
R2: ~₹1,007

“HDFCBANK : Symmetrical Wedge At Support With 1,057 BreakoutHDFC Bank on the daily chart is consolidating inside a symmetrical wedge after a sharp impulsive rally from the October swing low, with price holding above key short-term EMAs and the 984–990 demand zone support. A clean breakout above the wedge resistance and recent high near 1,020 could open the p

Price Action Trading1. What is Price Action Trading?
Price action trading is the analysis of raw price movement on a chart. It involves studying candlestick patterns, support and resistance zones, trendlines, breakouts, volume behavior, and the psychology behind market participants’ actions. Instead of using lagging i

HDFC BANK LTD PARALLEL CHANNEL BREAKOUTHDFC BANK was traded in channel from past few years and made a breakout with good volume. Entry price at ₹990, with a STOPLOSS ₹940 and TARGET ₹1,190

See all ideas
Summarizing what the indicators are suggesting.
Neutral
SellBuy
Strong sellStrong buy
Strong sellSellNeutralBuyStrong buy
Neutral
SellBuy
Strong sellStrong buy
Strong sellSellNeutralBuyStrong buy
Neutral
SellBuy
Strong sellStrong buy
Strong sellSellNeutralBuyStrong buy
An aggregate view of professional's ratings.
Neutral
SellBuy
Strong sellStrong buy
Strong sellSellNeutralBuyStrong buy
Neutral
SellBuy
Strong sellStrong buy
Strong sellSellNeutralBuyStrong buy
Neutral
SellBuy
Strong sellStrong buy
Strong sellSellNeutralBuyStrong buy
Displays a symbol's price movements over previous years to identify recurring trends.
705HDFCB31
HDFC Bank Limited 7.05% 01-DEC-2031Yield to maturity
7.47%
Maturity date
Dec 1, 2031
784HDFCB27
HDFC Bank Limited 7.84% PERPYield to maturity
7.22%
Maturity date
—
78HDFCB33
HDFC Bank Limited 7.8% 03-MAY-2033Yield to maturity
6.97%
Maturity date
May 3, 2033
775HDFCB33
HDFC Bank Limited 7.75% 13-JUN-2033Yield to maturity
6.94%
Maturity date
Jun 13, 2033
797HDFCB33
HDFC Bank Limited 7.97% 17-FEB-2033Yield to maturity
6.40%
Maturity date
Feb 17, 2033
HDB5548686
HDFC Bank Limited 5.686% 02-MAR-2026Yield to maturity
4.44%
Maturity date
Mar 2, 2026
769HDFCB33
HDFC Bank Limited 7.69% 27-JAN-2033Yield to maturity
—
Maturity date
Jan 27, 2033
786HDFC32
HDFC Bank Limited 7.86% 02-DEC-2032Yield to maturity
—
Maturity date
Dec 2, 2032
756HBL27
HDFC Bank Limited 7.56% 29-JUN-2027Yield to maturity
—
Maturity date
Jun 29, 2027
771HDFCB33
HDFC Bank Limited 7.71% 20-DEC-2033Yield to maturity
—
Maturity date
Dec 20, 2033
HDFB5243078
HDFC Bank Limited 3.7% PERPYield to maturity
—
Maturity date
—
See all HDFCBANK bonds
Curated watchlists where HDFCBANK is featured.

Indian stocks: Racing ahead
46 No. of Symbols
See all sparks
Frequently Asked Questions
The current price of HDFCBANK is 996.40 INR — it has increased by 0.91% in the past 24 hours. Watch HDFC Bank Limited stock price performance more closely on the chart.
Depending on the exchange, the stock ticker may vary. For instance, on BSE exchange HDFC Bank Limited stocks are traded under the ticker HDFCBANK.
HDFCBANK stock has risen by 0.36% compared to the previous week, the month change is a −0.56% fall, over the last year HDFC Bank Limited has showed a 11.96% increase.
We've gathered analysts' opinions on HDFC Bank Limited future price: according to them, HDFCBANK price has a max estimate of 1,460.00 INR and a min estimate of 1,046.00 INR. Watch HDFCBANK chart and read a more detailed HDFC Bank Limited stock forecast: see what analysts think of HDFC Bank Limited and suggest that you do with its stocks.
HDFCBANK reached its all-time high on Oct 23, 2025 with the price of 1,020.35 INR, and its all-time low was 13.10 INR and was reached on May 17, 2004. View more price dynamics on HDFCBANK chart.
See other stocks reaching their highest and lowest prices.
See other stocks reaching their highest and lowest prices.
HDFCBANK stock is 1.12% volatile and has beta coefficient of −0.08. Track HDFC Bank Limited stock price on the chart and check out the list of the most volatile stocks — is HDFC Bank Limited there?
Today HDFC Bank Limited has the market capitalization of 15.19 T, it has decreased by −1.59% over the last week.
Yes, you can track HDFC Bank Limited financials in yearly and quarterly reports right on TradingView.
HDFC Bank Limited is going to release the next earnings report on Jan 19, 2026. Keep track of upcoming events with our Earnings Calendar.
HDFCBANK earnings for the last quarter are 12.10 INR per share, whereas the estimation was 11.29 INR resulting in a 7.17% surprise. The estimated earnings for the next quarter are 11.51 INR per share. See more details about HDFC Bank Limited earnings.
HDFC Bank Limited revenue for the last quarter amounts to 459.01 B INR, despite the estimated figure of 437.41 B INR. In the next quarter, revenue is expected to reach 460.44 B INR.
HDFCBANK net income for the last quarter is 196.11 B INR, while the quarter before that showed 162.58 B INR of net income which accounts for 20.62% change. Track more HDFC Bank Limited financial stats to get the full picture.
HDFC Bank Limited dividend yield was 1.20% in 2024, and payout ratio reached 23.70%. The year before the numbers were 1.35% and 21.57% correspondingly. See high-dividend stocks and find more opportunities for your portfolio.
As of Dec 24, 2025, the company has 214.55 K employees. See our rating of the largest employees — is HDFC Bank Limited on this list?
Like other stocks, HDFCBANK shares are traded on stock exchanges, e.g. Nasdaq, Nyse, Euronext, and the easiest way to buy them is through an online stock broker. To do this, you need to open an account and follow a broker's procedures, then start trading. You can trade HDFC Bank Limited stock right from TradingView charts — choose your broker and connect to your account.
Investing in stocks requires a comprehensive research: you should carefully study all the available data, e.g. company's financials, related news, and its technical analysis. So HDFC Bank Limited technincal analysis shows the strong buy rating today, and its 1 week rating is buy. Since market conditions are prone to changes, it's worth looking a bit further into the future — according to the 1 month rating HDFC Bank Limited stock shows the buy signal. See more of HDFC Bank Limited technicals for a more comprehensive analysis.
If you're still not sure, try looking for inspiration in our curated watchlists.
If you're still not sure, try looking for inspiration in our curated watchlists.