hulspinig top candle formation and
give confirmation by next bullish candle.
50-50% chance of trend from current level
HINDUNILVR trade ideas

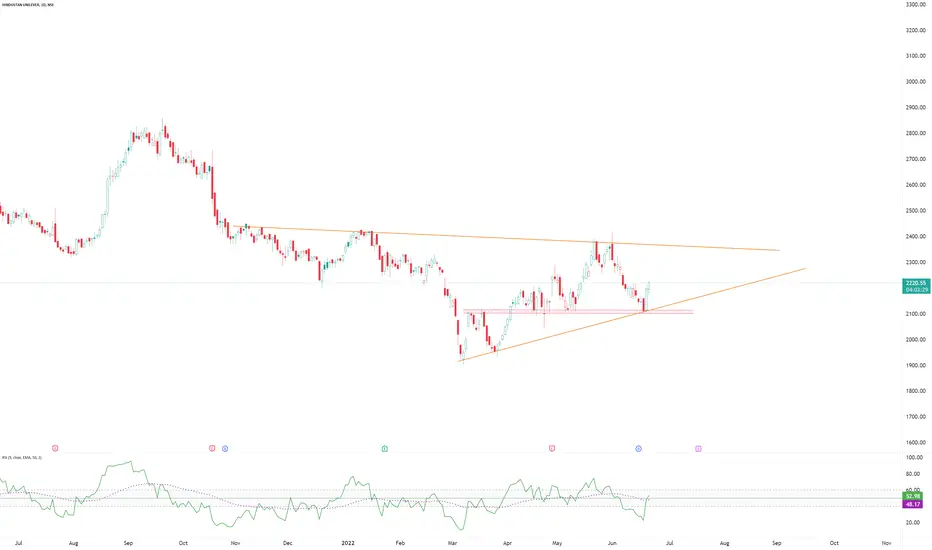
HINDUSTAN UNILEVER - Long-term Trend Analysis HINDUSTAN UNILEVER - Long-term Trend Analysis
1. It breaks the primary trend 9 months ago...
2. Now for the past 15 months in the long unwinding/Accumulation zone.
3. 2 options 1st If the trend moves upward means it has resistance at 2500 and 2700.
4. Only when it crosses 2700 it will be considered a bullish trend. otherwise, it will be on a bearish trend only.
5. Already it's fallen more than 33% from its all-time high.
6. Do you think will it fall further? Maybe yes based on the global market trend correction.
7. If it falls down what will be the support? 1st support will be at 1900 and 1750.
8. Stock is trading at 10.68 times its book value.
9. If the market crash it might fall to 1900. hope it won't touch the 2020 crash line.
Note:
1. I’m not a SEBI Registered advisor, my research is personal and for educational purposes only.
2. Always check with your financial advisor and take the trade as per your risk/reward ratio.
3. Follow me for more patterns and like, and share so that we feel it is helpful to many and share more patterns...

HINDUNILVR is feeling some resistance of trendline NSE:HINDUNILVR is also experiencing some resistance near trendline. This trendline worked as a support a few weeks back.

HINDUSTAN UNILEVER - 30th June 2022Stock finding Resistance at 2330-2300 Levels.
Bears in control and can try to push prices further downwards.

HulBearish hammer formation after doji candle and give confirmation bye next bearish candle.
Candle also on minor support.
Trend are negative.

HUL - Clear Breakdown on Monthly ChartsAs seen on charts, 6 year trendline broken on monthly charts.....Until close above 2413....It's a sell on rise....
AVOID STOCK IN PORTFOLIO....

Hindustan Unilever Bullish Anti Butterfly and Shark PatternHindustan Unilever Given Small Reversal from Anti Butterfly PRZ
If Fall is Continued then we can wait for reversal near Shark PRZ

HULstock may reverse from here due to ressistance so wait for confirmtion.
wait for break out or reversal.

hulrsi and price trend both show negative trend
wait for next support line because already break support in previous trading session

HINDUSTAN UNILEVER LONG FOR SWING TRADEbest buy will be below 2000 to 1900 range
must hold for 1 year for minimum 50% return

Hindustan Unilever Ltd AnalysisDividend Payout % = above 70% on average
PE = 55.85 ( book buy bw 36 and 44 PE)
BV increasing YOY
5 , 3 Year Profit higher than 10 year
Market leader based on market cap (10 times

Possible moves at HULPossible moves at HINDUNILVR, waiting for the price action patterns to frame based on pattern and trend we can take a decision for entry and exit

HINDUNI - BULLISHNot falling with the market
Standing tall within the range of 30 Rs (2130-2160)
Downside seems limited
Upside possible only if it sustains above 2160
With SL below 2130
For targets around 2250/2325
Keep an Eye !!!

HulRsi trend reversal with price bearish price trend
Stock near support line
May be reversal from support for short term

Hindustan Unilever Hul is near its major support zone 2180 even with nifty falling and high crude oil prices the stocks moved to 2200 from days low of 2170 it's looking very strong

HUL has more downside...be ready to buy at 1953I see the stock heading down to 1950/1953 level........be ready to buy the stock when it reaches this level...

HINDUSTAN UNILEVER Chart Analysis !!📈 Hindustan Unilever 📉
My Findings :-
1. Breakout from a Swing High.
2. Close Above March 2022 High.
Bias - Long
Target - 2315, 2417 and 2814
SL - 1943
RR- 1:4
All Important Supports and Resistances are drawn in chart. All levels are on closing basis.
Please have a look and revert back if you need some more study on it.
Disclaimer : Consult Your Financial Advisor Before Taking Any Decision On This Analysis.


HulTrend line break.
2207.40 is a major support line because it takes many time support and resistance in this level.
It may also break this level and touch the next level.

TLBO & resistance BOonly for education purpose not sugesstion
treadline breakout given by the stock & good retrecement also done
now started thier up move again


HUL 200 day ema BO retestNSE:HINDUNILVR
HUL BO & Retest pattern above 200 day EMA (blue).
currently trading above all major moving avgs..
If closes above 200 ema today then can initiate buy positions for longer term.
Very less risk takers can keep SL below last candle which is around 2250..
Positional Traders keep SL below 50 ema (orange) now. and later can trail with 200 ema breakdown method.
Positional target 2500 and 2700..
**Educational Purpose
