HUL Bullish View **Hindustan Unilever Ltd (HUL) Business Model**:
---
### **Hindustan Unilever Ltd (HUL) – Business Model Overview**
**1. Company Profile:**
* **Founded:** 1933
* **Headquarters:** Mumbai, India
* **Parent Company:** Unilever PLC (UK)
* **Industry:** FMCG (Fast-Moving Consumer Goods)
* **Market Cap (as of 2024):** ₹6.5+ lakh crore
---
### **2. Core Business Segments:**
HUL operates across **three main segments**:
| Segment | Products Included |
| -------------------------- | ---------------------------------------------------------- |
| **Home Care** | Surf Excel, Rin, Vim, Domex, Comfort, etc. |
| **Beauty & Personal Care** | Dove, Lux, Lifebuoy, Clinic Plus, Sunsilk, Pepsodent, etc. |
| **Foods & Refreshments** | Brooke Bond, Lipton, Knorr, Horlicks, Boost, Kissan, etc. |
---
### **3. Revenue Model:**
* **Primary Revenue Source:** Sale of FMCG products via retail and online channels.
* **Secondary Revenue Source:** Royalties & licensing fees from Unilever IP.
* **Strategy:** High-volume, low-margin model; focus on scale and reach.
---
### **4. Key Business Strategies:**
| Strategy | Description |
| ------------------------------ | ---------------------------------------------------------------------------- |
| **Brand Portfolio Management** | Owns 50+ brands across categories; premium to mass-market coverage. |
| **Distribution Network** | Over 8 million retail outlets across India; strong rural & urban reach. |
| **Innovation & R\&D** | Focus on local consumer needs, product customization, sustainable packaging. |
| **Digital Transformation** | Leveraging data, analytics, and e-commerce platforms for sales and outreach. |
| **Sustainability Focus** | Water conservation, plastic recycling, and zero-waste manufacturing. |
---
### **5. Cost Structure:**
* **Raw Materials:** A significant portion of costs; affected by global commodity prices.
* **Marketing & Advertising:** High spend to maintain brand recall.
* **Distribution & Logistics:** Critical for reach in both urban and rural areas.
---
### **6. Target Market:**
* **Urban Middle & Upper-Class**
* **Rural Consumers**
* **Health-Conscious & Youth Segments** (growing focus)
---
### **7. Competitive Advantages:**
* Strong **brand loyalty**.
* Deep **distribution** network.
* Parent support from **Unilever Global**.
* **Scale of operations** gives cost efficiency.
---
### **8. Challenges:**
* Rural slowdown or inflation impacting volumes.
* Raw material price volatility.
* Intense competition from both domestic (Patanjali, Dabur) and global players (P\&G, Colgate).
---
### **9. Growth Drivers:**
* Premiumization of products.
* Expanding into wellness, ayurveda, and healthy food.
* Increasing e-commerce and digital sales channels.
* Rural penetration and aspirational consumption.
---
### **10. Conclusion:**
HUL runs a **resilient, scalable, and consumer-centric business model** that thrives on branding, distribution, and deep consumer insight. With a focus on **sustainability, innovation**, and **digitalization**, it remains a leader in the Indian FMCG space.
---
Thanks & Regards
The Golden Farms of Equity
HINDUNILVR trade ideas

Hindustan Uniliver Bullish StructureHere's a detailed explanation of the **Hindustan Unilever Ltd (HUL) Business Model**:
---
### **Hindustan Unilever Ltd (HUL) – Business Model Overview**
**1. Company Profile:**
* **Founded:** 1933
* **Headquarters:** Mumbai, India
* **Parent Company:** Unilever PLC (UK)
* **Industry:** FMCG (Fast-Moving Consumer Goods)
* **Market Cap (as of 2024):** ₹6.5+ lakh crore
---
### **2. Core Business Segments:**
HUL operates across **three main segments**:
| Segment | Products Included |
| -------------------------- | ---------------------------------------------------------- |
| **Home Care** | Surf Excel, Rin, Vim, Domex, Comfort, etc. |
| **Beauty & Personal Care** | Dove, Lux, Lifebuoy, Clinic Plus, Sunsilk, Pepsodent, etc. |
| **Foods & Refreshments** | Brooke Bond, Lipton, Knorr, Horlicks, Boost, Kissan, etc. |
---
### **3. Revenue Model:**
* **Primary Revenue Source:** Sale of FMCG products via retail and online channels.
* **Secondary Revenue Source:** Royalties & licensing fees from Unilever IP.
* **Strategy:** High-volume, low-margin model; focus on scale and reach.
---
### **4. Key Business Strategies:**
| Strategy | Description |
| ------------------------------ | ---------------------------------------------------------------------------- |
| **Brand Portfolio Management** | Owns 50+ brands across categories; premium to mass-market coverage. |
| **Distribution Network** | Over 8 million retail outlets across India; strong rural & urban reach. |
| **Innovation & R\&D** | Focus on local consumer needs, product customization, sustainable packaging. |
| **Digital Transformation** | Leveraging data, analytics, and e-commerce platforms for sales and outreach. |
| **Sustainability Focus** | Water conservation, plastic recycling, and zero-waste manufacturing. |
---
### **5. Cost Structure:**
* **Raw Materials:** A significant portion of costs; affected by global commodity prices.
* **Marketing & Advertising:** High spend to maintain brand recall.
* **Distribution & Logistics:** Critical for reach in both urban and rural areas.
---
### **6. Target Market:**
* **Urban Middle & Upper-Class**
* **Rural Consumers**
* **Health-Conscious & Youth Segments** (growing focus)
---
### **7. Competitive Advantages:**
* Strong **brand loyalty**.
* Deep **distribution** network.
* Parent support from **Unilever Global**.
* **Scale of operations** gives cost efficiency.
---
### **8. Challenges:**
* Rural slowdown or inflation impacting volumes.
* Raw material price volatility.
* Intense competition from both domestic (Patanjali, Dabur) and global players (P\&G, Colgate).
---
### **9. Growth Drivers:**
* Premiumization of products.
* Expanding into wellness, ayurveda, and healthy food.
* Increasing e-commerce and digital sales channels.
* Rural penetration and aspirational consumption.
---
### **10. Conclusion:**
HUL runs a **resilient, scalable, and consumer-centric business model** that thrives on branding, distribution, and deep consumer insight. With a focus on **sustainability, innovation**, and **digitalization**, it remains a leader in the Indian FMCG space.
---
Thanks & Regards
Mohinder Singh
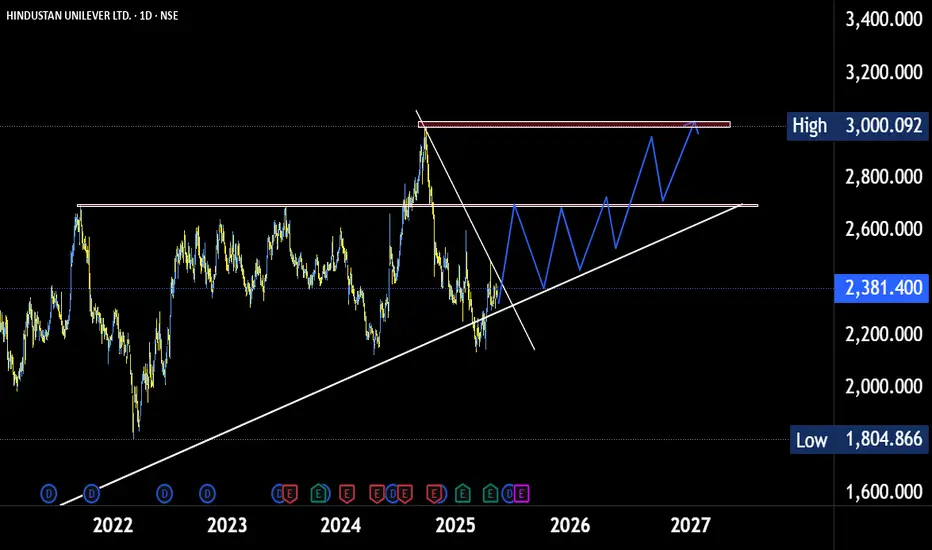
Hindunilever-will history repeatHUL is awaiting breakout repeating the historical successful pattern--Seems 2800 is tgt

Hindunilvr longing for a breakout??!!Chart patterns inflict me the above titled opinion
Breakout can be expected as it has not breached the low made on 25th april 2025 and has been consistently making higher highs and higher lows(seen clearly on hourly charts)
Entry after the breakout.. ...
Godrejcp also seen for a up move!!!!
will update once it breaks out!!!!
Thank you.
This is just my opinion...not a advice!!!!
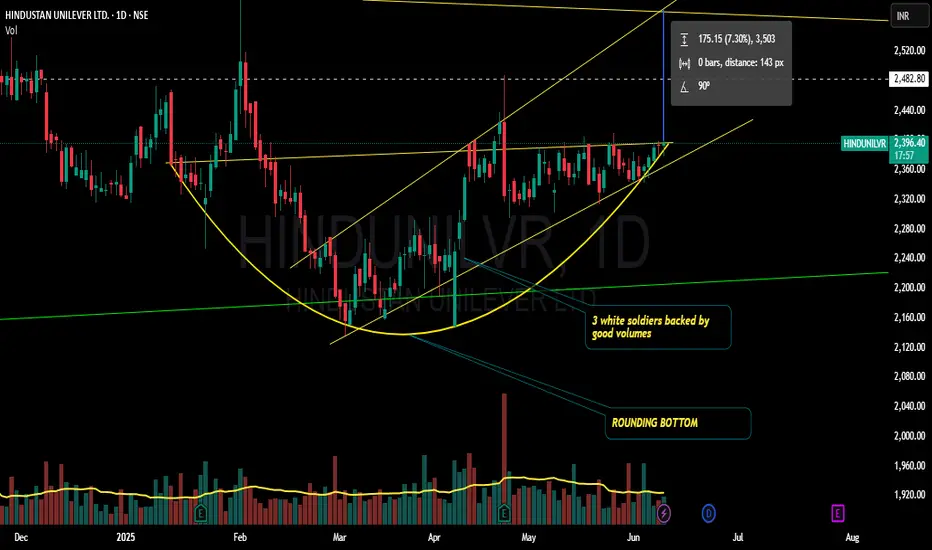
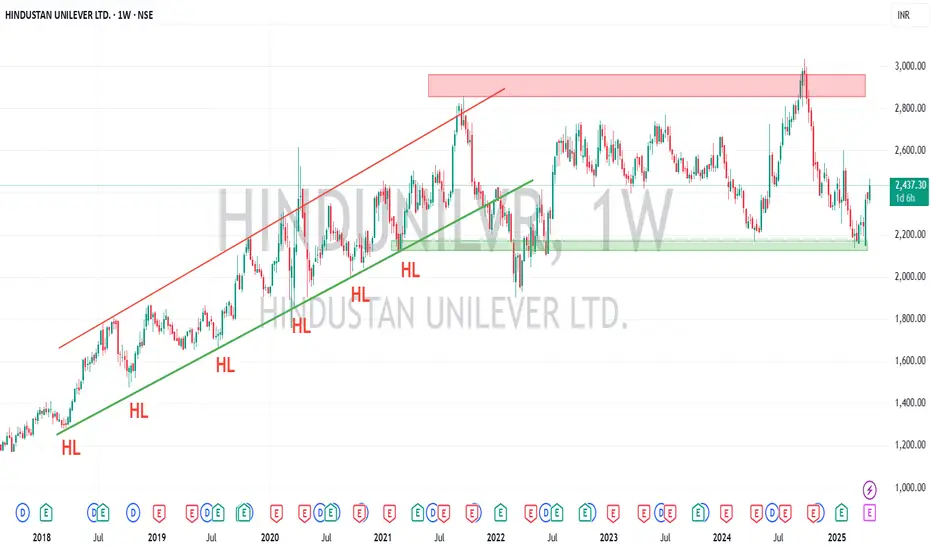
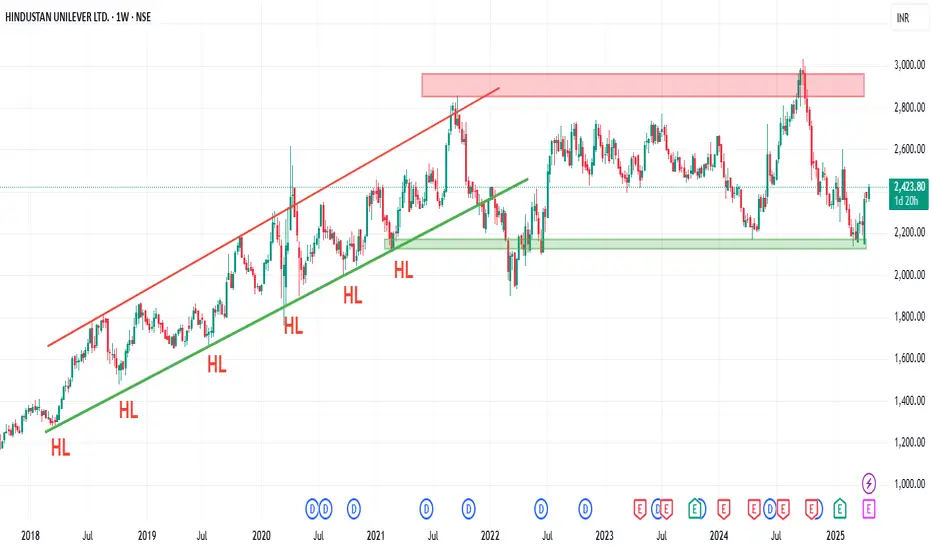
HINDUNILVR - Weekly AnalysisIn the Weekly Chart of HINDUNILVR ,
we can see that, it can give a Cup & Handle breakout at 2400 level.
Expected momentum is shown in chart.
Hindustan Uniliver Ltd Charts AnalysisHere is a detailed business model for **Hindustan Unilever Limited (HUL)**, one of India’s largest fast-moving consumer goods (FMCG) companies:
---
# **HUL Ltd – Detailed Business Model**
## **1. Company Overview**
* **Name:** Hindustan Unilever Limited (HUL)
* **Parent Company:** Unilever Plc (UK-based multinational)
* **Founded:** 1933 (as Lever Brothers)
* **Headquarters:** Mumbai, Maharashtra, India
* **Sector:** FMCG (Fast-Moving Consumer Goods)
* **Stock Listing:** NSE and BSE (Ticker: HINDUNILVR)
---
## **2. Value Proposition**
HUL offers a diverse portfolio of trusted brands across multiple categories that cater to the everyday needs of Indian consumers. Its core value propositions include:
* High-quality products at affordable prices
* Deep understanding of Indian consumer preferences
* Nationwide reach with strong brand loyalty
* Sustainability-driven business practices
---
## **3. Key Products & Brands**
### **A. Home Care**
* **Brands:** Surf Excel, Rin, Wheel, Comfort, Vim, Domex
* **Products:** Detergents, Dishwashers, Surface cleaners, Toilet cleaners
### **B. Beauty & Personal Care**
* **Brands:** Dove, Lux, Lifebuoy, Sunsilk, Clinic Plus, Pepsodent, Close-Up, Lakmé, Pond’s
* **Products:** Soaps, Shampoos, Toothpastes, Deodorants, Skincare, Cosmetics
### **C. Foods & Refreshments**
* **Brands:** Brooke Bond, Lipton, Bru, Knorr, Kissan, Horlicks, Boost
* **Products:** Tea, Coffee, Health Drinks, Jams, Soups, Sauces
---
## **4. Customer Segments**
* **Mass Market:** Products targeted at a wide range of income groups
* **Urban & Rural Consumers:** Tailored product SKUs (stock-keeping units) for affordability
* **Health & Wellness Seekers:** Nutritional and hygiene-focused products
* **Premium Consumers:** Premium ranges under brands like Dove, Lakmé, etc.
---
## **5. Channels (Distribution Model)**
HUL has a **multi-tiered distribution system** that reaches over 8 million retail outlets across India.
### **A. General Trade (GT)**
* Traditional mom-and-pop stores (kirana stores)
* Rural distribution with direct coverage of over 250,000 villages
### **B. Modern Trade (MT)**
* Supermarkets, hypermarkets, convenience stores
* Partnerships with large retail chains (e.g., Big Bazaar, Reliance Retail)
### **C. E-Commerce**
* Presence on platforms like Amazon, Flipkart, BigBasket
* Direct-to-consumer channels via brand websites
### **D. HUL Shikhar App**
* A digital ordering platform for retailers and distributors
---
## **6. Key Activities**
* Product innovation and R\&D
* Brand building and marketing
* Supply chain and logistics management
* Customer and retailer relationship management
* Sustainability and CSR initiatives
---
## **7. Key Resources**
* Strong brand portfolio
* Human capital (employees, management, R\&D experts)
* Manufacturing facilities (30+ factories across India)
* Distribution network
* Digital capabilities and data analytics
---
## **8. Revenue Streams**
HUL earns revenue primarily from the **sale of consumer products**, categorized into:
* Home Care (\~35–40%)
* Beauty & Personal Care (\~40–45%)
* Foods & Refreshments (\~15–20%)
Revenue is generated via both **domestic sales** and **exports**.
---
## **9. Cost Structure**
* Raw materials (agriculture-based & chemicals)
* Advertising and marketing (\~12% of revenues typically)
* Distribution and logistics
* Manufacturing and operations
* Research and development
---
## **10. Partnerships**
* Parent company Unilever provides R\&D, global brand assets
* Distributors, logistics providers, and retailers
* Third-party manufacturers
* NGOs and government bodies (for social initiatives)
---
## **11. Sustainability & CSR**
HUL integrates sustainability into its core strategy through:
* **Plastic reduction and recycling**
* **Water conservation (Project Jalagraha)**
* **Women empowerment (Project Shakti)**
* **Health and hygiene awareness (Lifebuoy campaigns)**
---
## **12. Competitive Advantage**
* Massive distribution footprint across India
* Strong brand equity and consumer trust
* Innovation tailored to Indian market
* Operational efficiency and scale
* Digital transformation and data-driven decision making
---
## **13. Challenges**
* Intense competition from other FMCG players (e.g., P\&G, ITC, Dabur, Patanjali)
* Price sensitivity of Indian consumers
* Rural supply chain complexities
* Regulatory and environmental pressures
---
## **14. Growth Strategies**
* Expanding rural reach
* Digital and e-commerce expansion
* Health and wellness product innovation
* Premiumization of existing brands
* Strategic acquisitions (e.g., GSK Consumer Health – Horlicks)
---
Thanks @ Regards
The Golden Farms of Equity
Available On Social Media Handles

HINDUNILVRFMCG comapany Hindustan Unililver is trading at its support area which is being defended from last 2 years, reversal can take place in this stock in coming month as per MACD and RSI divergences.

HINDUNILVR - Weekly AnalysisIn the Weekly Chart of HINDUNILVR ,
we can see that, it can give a Cup & Handle breakout at 2400 level.
Let it create a Halt candle for respect.
Expected momentum is shown in chart.
Hindustan Uniliver Ltd Long Term View At Least 52 WeeksHere is a **brief profile of Hindustan Unilever Limited (HUL):**
---
### **Hindustan Unilever Limited (HUL) – Company Profile**
* **Full Name**: Hindustan Unilever Limited
* **Type**: Public Company
* **Industry**: Fast-Moving Consumer Goods (FMCG)
* **Founded**: 1933 (as Lever Brothers India Limited)
* **Headquarters**: Mumbai, Maharashtra, India
* **Parent Company**: Unilever PLC (UK)
---
### **Overview**
Hindustan Unilever Limited is one of India’s largest and most respected FMCG companies. It operates as a subsidiary of the global consumer goods giant **Unilever**. HUL has a wide-ranging portfolio that touches the daily lives of millions of consumers across India.
---
### **Key Business Segments**
1. **Home Care** – Surf Excel, Rin, Vim, Domex
2. **Beauty & Personal Care** – Dove, Lifebuoy, Lux, Sunsilk, Pond's, Fair & Lovely (now Glow & Lovely)
3. **Foods & Refreshments** – Brooke Bond, Lipton, Kissan, Horlicks, Knorr, Kwality Wall’s
---
### **Key Facts**
* **Revenue**: ₹60,000+ crore (FY 2023-24, approx.)
* **Employees**: \~21,000
* **Listed On**: BSE & NSE (Ticker: HINDUNILVR)
* **CSR Focus Areas**: Health, hygiene, nutrition, sustainability, water conservation
* **Notable Acquisition**: GSK Consumer Healthcare India (Horlicks, Boost brands)
---
### **Mission Statement**
“To make sustainable living commonplace.”
-
HUL on the Rise: Strong Support & Bullish Outlook Ahead of Q4🔍Technical Analysis: Resilience in a Defined Range
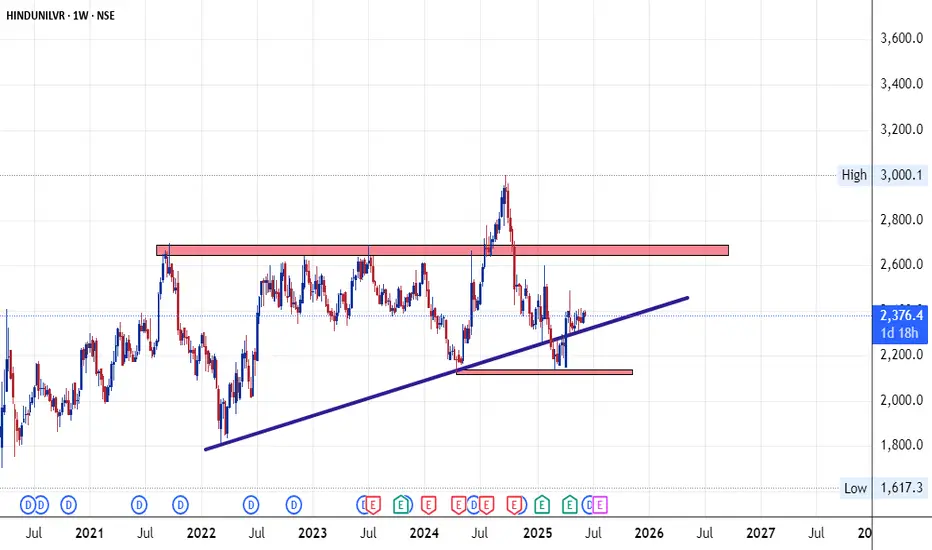
Over the past decade, Hindustan Unilever Ltd (HUL) has exhibited a commendable upward trajectory, characterized by a consistent pattern of higher highs and higher lows from 2018 to 2021. Since 2021, the stock has been oscillating within a well-defined range of ₹2,000 to ₹3,000. Notably, the ₹3,000 mark has acted as a significant resistance level, while the ₹2,100–₹2,200 zone has provided robust support.
In recent weeks, HUL has demonstrated resilience by rebounding from the ₹2,100–₹2,200 support zone, indicating renewed buying interest. This movement suggests a potential bullish momentum, especially if the stock sustains above this support.
Key Technical Levels:
Support Zones: ₹2,100–₹2,200 (Primary), ₹1,900 (Secondary)
Resistance Levels: ₹2,800 (Initial Target), ₹2,900 (Secondary Target), ₹3,000 (Tertiary Target)
Investors should monitor these levels closely, especially with the upcoming Q4 FY25 results scheduled for April 24, 2025. A positive earnings report could propel the stock towards its all-time high, while any negative surprises might test the established support zones.
📊Fundamental Analysis:
Over the past two months, HUL's stock has witnessed an upward movement. Several factors contribute to this trend:
Positive Q3 FY24 Earnings: The company's ability to maintain profitability despite market headwinds has instilled confidence among investors.
Anticipation of Q4 Results: With the Q4 FY25 results scheduled for April 24, 2025, market participants are optimistic about continued positive performance, potentially driving the stock higher.
Defensive Sector Appeal: As a leading player in the FMCG sector, HUL is considered a defensive stock, attracting investors seeking stability amidst market volatility.
📌Q3 FY24 Key Financial Highlights:
Total Income: ₹15,818 Cr (vs ₹15,926 Cr in Q2 FY24 and ₹15,567 Cr in Q3 FY23)
Total Expenses: ₹12,123 Cr (vs ₹12,139 Cr in Q2 FY24 and ₹11,902 Cr in Q3 FY23)
Total Operating Profits: ₹3,695 Cr (vs ₹3,787 Cr in Q2 FY24 and ₹3,665 Cr in Q3 FY23)
Profit Before Tax: ₹3,982 Cr (vs ₹3,542 Cr in Q2 FY24 and ₹3,445 Cr in Q3 FY23)
Profit After Tax: ₹2,989 Cr (vs ₹2,595 Cr in Q2 FY24 and ₹2,508 Cr in Q3 FY23)
Diluted Normalized EPS: ₹12.70 (vs ₹11.03 in Q2 FY24 and ₹10.68 in Q3 FY23)
🔹 Growth in the Home Care and Beauty & Wellbeing segments contributed to the rise.
🔹 Operating margins improved due to better cost controls and volume-led growth.
🔹 Investor sentiment has been optimistic ahead of Q4 results, helping the stock gain in the past 2 months.
✅Conclusion:
HUL is showing signs of bullish continuation if Q4 results support it. Key levels are clear — ₹2,100 is your safety net, and ₹3,000 your breakout goal. Watch results on April 24, and plan accordingly.
Disclaimer: lnkd.in
HUL on the Rise: Strong Support & Bullish Outlook Ahead of Q4🔍 Technical Analysis: Resilience in a Defined Range
Over the past decade, Hindustan Unilever Ltd (HUL) has exhibited a commendable upward trajectory, characterized by a consistent pattern of higher highs and higher lows from 2018 to 2021. Since 2021, the stock has been oscillating within a well-defined range of ₹2,000 to ₹3,000. Notably, the ₹3,000 mark has acted as a significant resistance level, while the ₹2,100–₹2,200 zone has provided robust support.
In recent weeks, HUL has demonstrated resilience by rebounding from the ₹2,100–₹2,200 support zone, indicating renewed buying interest. This movement suggests a potential bullish momentum, especially if the stock sustains above this support.
Key Technical Levels:
Support Zones: ₹2,100–₹2,200 (Primary), ₹1,900 (Secondary)
Resistance Levels: ₹2,800 (Initial Target), ₹2,900 (Secondary Target), ₹3,000 (Tertiary Target)
Investors should monitor these levels closely, especially with the upcoming Q4 FY25 results scheduled for April 24, 2025. A positive earnings report could propel the stock towards its all-time high, while any negative surprises might test the established support zones.
📊 Fundamental Analysis:
Over the past two months, HUL's stock has witnessed an upward movement. Several factors contribute to this trend:
Positive Q3 FY24 Earnings: The company's ability to maintain profitability despite market headwinds has instilled confidence among investors.
Anticipation of Q4 Results: With the Q4 FY25 results scheduled for April 24, 2025, market participants are optimistic about continued positive performance, potentially driving the stock higher.
Defensive Sector Appeal: As a leading player in the FMCG sector, HUL is considered a defensive stock, attracting investors seeking stability amidst market volatility.
📌 Q3 FY24 Key Financial Highlights:
Total Income: ₹15,818 Cr (vs ₹15,926 Cr in Q2 FY24 and ₹15,567 Cr in Q3 FY23)
Total Expenses: ₹12,123 Cr (vs ₹12,139 Cr in Q2 FY24 and ₹11,902 Cr in Q3 FY23)
Total Operating Profits: ₹3,695 Cr (vs ₹3,787 Cr in Q2 FY24 and ₹3,665 Cr in Q3 FY23)
Profit Before Tax: ₹3,982 Cr (vs ₹3,542 Cr in Q2 FY24 and ₹3,445 Cr in Q3 FY23)
Profit After Tax: ₹2,989 Cr (vs ₹2,595 Cr in Q2 FY24 and ₹2,508 Cr in Q3 FY23)
Diluted Normalized EPS: ₹12.70 (vs ₹11.03 in Q2 FY24 and ₹10.68 in Q3 FY23)
🔹 Growth in the Home Care and Beauty & Wellbeing segments contributed to the rise.
🔹 Operating margins improved due to better cost controls and volume-led growth.
🔹 Investor sentiment has been optimistic ahead of Q4 results, helping the stock gain in the past 2 months.
✅ Conclusion :
HUL is showing signs of bullish continuation if Q4 results support it. Key levels are clear — ₹2,100 is your safety net, and ₹3,000 your breakout goal. Watch results on April 24, and plan accordingly.
⚠️ Disclaimer :
This report is for educational and informational purposes only and does not constitute investment advice. Please consult your financial advisor before investing.
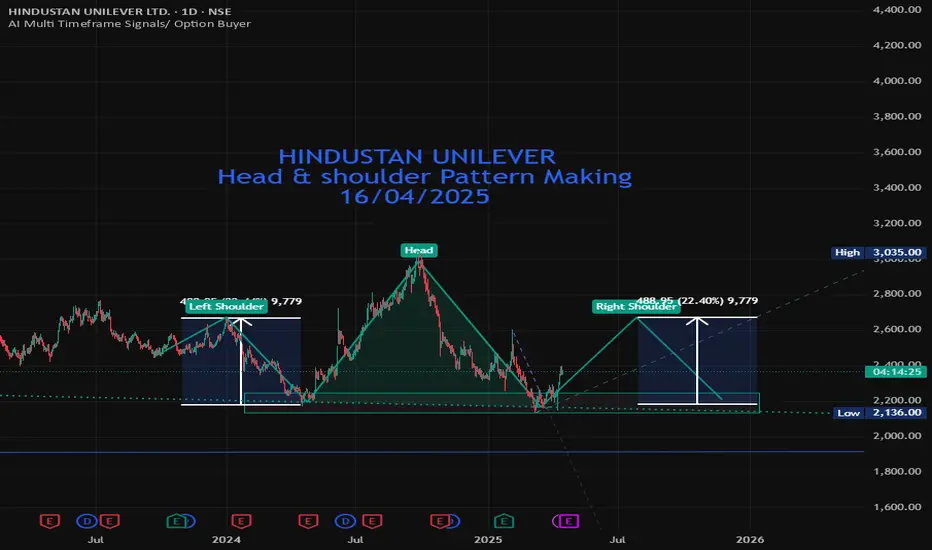
HINDUSTAN UNILEVER Head & shoulder Pattern Making 16/04/25NSE INDIA, Symbol : HINDUSTAN UNILEVER Timeframe : Daily. HINDUSTAN UNILEVER I was predicted on dated 24/02/2025 HINDUSTAN UNILEVER on demand zone. Lot of time trade on demand zone and today bonus back HINDUSTAN UNILEVER trade over demand zone . HINDUSTAN UNILEVER also detected Head and shoulder pattern then next target is Left shoulder height 2670
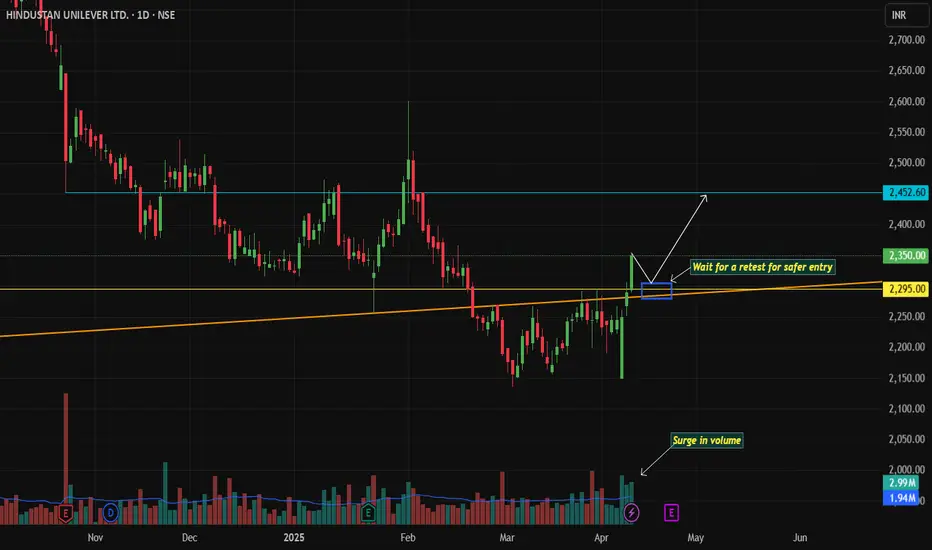
HUL Trade Setup: Breakout Retest Play LevelsHindustan Unilever (HUL) Trading Plan
▬▬▬▬▬▬▬▬▬▬▬▬
Context
Gap Down Recovery: Massive gap down on 7th April followed by sustained upward momentum.
Breakout Confirmation: Closed above key horizontal resistance (2295) and trendline confluence.
Entry Strategy
Organic Entry: Wait for retest of 2295 (now support) for bullish confirmation (e.g., bounce, volume surge).
Aggressive Entry: Enter directly above 2295 with a strict stop loss at 2289.
Target & Risk Management
Target: 2452 (aligns with swing high structure).
Stop Loss: 2289 (below breakout level to invalidate the setup).
Key Notes
Confluence of horizontal + trendline breakout strengthens bullish bias.
Monitor price action for retest confirmation; avoid chasing if momentum stalls.
Risk-Reward: ~1:5 (SL: 16 pts | Target: 157+ pts).
▬▬▬▬▬▬▬▬▬▬▬▬
Trade with discipline. Adjust SL to breakeven at 2350 if target 1 (2400) is hit. 🎯
Hindustan Unilever (HUL) | Counter-Trend Bullish & Bearish TrendCurrent Market Price (CMP): ₹2,176.85
Major Trend: Bearish As on 03.03.2025
🔴 The overall trend remains negative, but we have identified key levels for both a counter-trend bullish move and trend continuation.
Bearish Trend Continuation Setup
Short Position Setup (Continuing the Downtrend)
Entry Zone: ₹2,199 - ₹2,245 (Bearish FVG Resistance)
Confirmation Entry: ₹2,336 - ₹2,420 (Stronger Resistance)
Target 1: ₹2,128 (Bullish FVG Support)
Target 2: ₹2,051 (Deeper Support)
Breakdown Target: ₹1,982 - ₹1,961 (Major Support)
Stop Loss: Above ₹2,420 (Invalidation of Bearish Structure
Rationale:
Bearish FVG Resistance Zones indicate potential supply zones where sellers might step in.
The trend remains down, and failure at resistance could lead to further downside moves.
Bullish Counter-Trend Setup
Long Position Setup (Reversal Play)
Entry Zone: ₹2,128 - ₹2,088 (Bullish FVG Support)
Confirmation Entry: ₹2,051 (Stronger Support)
Target 1: ₹2,199 - ₹2,245 (Bearish FVG Resistance)
Target 2: ₹2,336 (Key Resistance Level)
Invalidation: Below ₹1,961 (Breakdown Below Major Support)
Rationale:
Bullish FVG Zones act as demand areas, where buyers may step in.
If price bounces from these levels, a short-term reversal move is possible towards resistance.
Technical Summary
Major Trend: ❌ BearishBullish FVG Support: 🟢 ₹2,128 - ₹2,051
Bearish FVG Resistance: 🔴 ₹2,199 - ₹2,420
Key Invalidation Level: ⚠ ₹1,961 (Breakdown Level)

hindustan unilive revised target for buy is 2020**Hindustan Unilever Limited (HUL)** is India’s largest **FMCG (Fast-Moving Consumer Goods)** company, producing a wide range of daily-use consumer products. It is a subsidiary of **Unilever**, a global consumer goods giant.
---
### **Key Facts About HUL:**
- **Founded:** 1933 (as Hindustan Vanaspati Manufacturing Co.)
- **Headquarters:** Mumbai, India
- **CEO & MD:** Rohit Jawa (as of recent updates)
- **Parent Company:** Unilever (owns ~62% of HUL)
- **Revenue:** Over **₹60,000 crore** (varies yearly)
- **Stock Listing:** **NSE & BSE** (Ticker: **HINDUNILVR**)
- **Market Cap:** Among India's top FMCG companies (₹6+ lakh crore)
---
### **Major Business Segments & Brands:**
#### **1. Home Care**
- **Detergents:** Surf Excel, Rin, Wheel
- **Dishwash:** Vim
- **Purifiers:** Pureit
#### **2. Beauty & Personal Care**
- **Soaps & Body Wash:** Lux, Dove, Pears, Lifebuoy
- **Shampoos & Conditioners:** Clinic Plus, Sunsilk, TRESemmé
- **Oral Care:** Pepsodent, Close-Up
- **Skincare & Cosmetics:** Fair & Lovely (now Glow & Lovely), Ponds, Lakmé
#### **3. Foods & Beverages**
- **Tea & Coffee:** Brooke Bond Red Label, Lipton, Taaza, Bru
- **Health Drinks:** Horlicks, Boost (acquired from GSK Consumer)
- **Ketchup & Soups:** Kissan, Knorr
- **Ice Creams:** Kwality Wall’s, Magnum
---
### **Sustainability & Digital Expansion**
- **Plastic-free packaging & carbon neutrality** goals.
- **E-commerce & digital sales growing rapidly** (partnerships with JioMart, Amazon, Flipkart).
---
### **Competitors:**
- **FMCG Giants:** ITC, Nestlé India, Dabur, Patanjali, P&G, Marico
- **Retail & E-commerce:** Reliance Retail, Amazon, Flipkart
HUL dominates the **consumer goods** sector with strong brands across **personal care, home care, and food & beverages**. Are you looking for **financial details, market trends, or stock insights**? 🚀

Hindustan Unilever Ltd. (HUL) Stock Analysis### **Hindustan Unilever Ltd. (HUL) Stock Analysis**
---
#### **Fundamental Analysis:**
- **Company Overview:**
Hindustan Unilever Ltd. (HUL) is one of India’s largest consumer goods companies, operating in diverse sectors such as home care, personal care, foods, refreshments, and health & wellness. It is a subsidiary of Unilever, one of the world's leading suppliers of food, beverages, and consumer products.
- **Revenue & Profit Growth:**
- HUL has consistently delivered stable revenue and profit growth, supported by a strong brand portfolio and distribution network. For Q3 FY2025, the company reported a 13% YoY growth in net profit, totaling ₹2,200 crore.
- The company’s revenue growth is driven by its dominant presence in the Indian market across categories like personal care (Dove, Lux), home care (Surf Excel, Rin), and foods (Knorr, Lipton).
- **Valuation (as of Feb 2025):**
- **P/E Ratio:** 60.5 (higher than the industry average, reflecting premium valuations due to consistent growth and market leadership)
- **Price-to-Book Ratio:** 16.5 (indicating strong market expectations for long-term growth)
- **Dividend Yield:** 1.2% (the company has a robust dividend payout track record)
- **Key Ratios:**
- **Return on Equity (ROE):** 90% (indicating exceptional return on shareholders' equity, a testament to HUL’s efficient operations)
- **Return on Assets (ROA):** 27% (shows the company’s effectiveness in utilizing its assets to generate profit)
- **Debt-to-Equity Ratio:** 0.15 (low leverage, indicating HUL’s strong balance sheet and ability to generate growth without relying heavily on debt)
- **Outlook:**
HUL has maintained its leadership position in the Indian consumer goods market. Its diversified product range, strong brand equity, and extensive distribution network position it well for long-term growth. However, its high valuation relative to the broader market may limit upside potential in the near term. Investors should monitor input costs (e.g., raw materials) and demand fluctuations in key sectors, such as personal care and home care.
---
#### **Technical Analysis:**
- **Current Price:** ₹2,830 (as of February 2025)
- **Chart Overview:**
HUL has been in a strong uptrend for the past several years, with a history of consistent positive performance. It recently faced some resistance near ₹2,880 but remains in an overall bullish trend, supported by strong institutional buying.
- **Support and Resistance Levels:**
- **Immediate Support:** ₹2,750 (a strong level where buying interest has historically emerged)
- **Next Major Support:** ₹2,600 (important long-term support level)
- **Immediate Resistance:** ₹2,880 (previous high, a breakout above this could trigger further upside)
- **Next Major Resistance:** ₹3,000 (psychologically significant level, if breached, could lead to significant upward movement)
- **Moving Averages:**
- **50-Day Moving Average (50-DMA):** ₹2,780 (indicating bullish sentiment in the short term)
- **200-Day Moving Average (200-DMA):** ₹2,500 (providing strong long-term support)
- **Relative Strength Index (RSI):**
- RSI stands at 70, indicating the stock is approaching overbought territory. This suggests that HUL may experience a short-term pullback or consolidation before further upward movement.
- **MACD:**
- The MACD has shown a bullish crossover, suggesting the continuation of the uptrend. However, with the RSI in the overbought zone, a short-term correction or consolidation may occur before the stock resumes its upward momentum.
---
#### **Key Metrics:**
- **Market Capitalization:** ₹6.4 lakh crore (approx.)
- **52-Week High:** ₹2,920
- **52-Week Low:** ₹2,250
---
#### **Risk Considerations:**
- **Valuation Risk:** The stock’s high P/E ratio suggests that it is trading at a premium compared to the market, and any slowdown in growth could result in a correction.
- **Commodity Price Risks:** As a major player in the FMCG sector, HUL is sensitive to fluctuations in raw material costs, such as palm oil and other agricultural commodities. Increases in these costs could compress margins.
- **Competition:** The FMCG sector is highly competitive, with numerous global and local players vying for market share. While HUL has a strong brand portfolio, increasing competition from both traditional and emerging brands can put pressure on margins and market share.
- **Regulatory Risks:** Changes in government policies related to taxes, regulations, or consumer preferences could impact HUL’s business.
---
### **Conclusion:**
Hindustan Unilever remains one of the most reliable stocks in the Indian FMCG sector, offering strong financial performance, consistent growth, and robust market leadership. The stock is currently trading at a premium valuation, and while it continues to show growth, potential investors should be cautious of the high valuation risk. Technically, HUL is in a bullish trend with support at ₹2,750 and resistance at ₹2,880. However, given the overbought RSI, there could be short-term corrections, and investors should watch for a potential pullback before initiating fresh buys.
---
**Disclaimer:** This analysis is based on publicly available information, and I am not a SEBI-registered advisor. Please conduct your own research and consult a certified financial advisor before making any investment decisions. This is for informational purposes only and should not be considered as financial advice.

HINDUSTAN UNILEVER ON DEMAND ZONE 24/02/2025Symbol : HINDUNI , Exchange : NSE India , Timeframe : Daily Today HINDUNI IN Demand zone
Bothe side Move be possible

what is pivot points and why it super useful ?**Pivot points** are key technical indicators used by traders to identify potential support and resistance levels in the market. They are widely used in various markets, such as stocks, forex, and futures, to help traders determine the overall market trend and make decisions about entry, exit, and stop-loss levels.
### What are Pivot Points?
Pivot points are calculated using the **high**, **low**, and **closing prices** from the previous trading period (day, week, or month). These calculations create a set of price levels, including the main **pivot point (P)** and several support and resistance levels (S1, S2, S3 for support, and R1, R2, R3 for resistance).
### Basic Calculation of Pivot Points:
1. **Pivot Point (P)**:
\
2. **Support and Resistance Levels**:
- **First Support (S1)** = (2 × P) - High
- **First Resistance (R1)** = (2 × P) - Low
- **Second Support (S2)** = P - (High - Low)
- **Second Resistance (R2)** = P + (High - Low)
- **Third Support (S3)** = Low - 2 × (High - P)
- **Third Resistance (R3)** = High + 2 × (P - Low)
These calculations give you the **pivot point** (the most likely level of price equilibrium), **support levels** (prices where the market could find buying interest), and **resistance levels** (prices where the market might face selling pressure).
### Why Pivot Points are Super Useful
1. **Key Support and Resistance Levels**
Pivot points provide traders with important levels where prices are likely to encounter support or resistance. These levels are critical for making trading decisions, including:
- **Entry Points**: Traders can use pivot points to identify entry points. If the price is near support and shows signs of reversal, traders might buy, expecting the price to bounce back.
- **Exit Points**: Conversely, if the price approaches resistance and shows signs of weakness, traders may decide to sell or exit positions.
2. **Identifying Market Trend**
Pivot points are especially useful for determining the **market trend**:
- **Bullish Market**: If the price is trading above the pivot point, it generally indicates a bullish market, and traders may look for buying opportunities.
- **Bearish Market**: If the price is trading below the pivot point, it generally indicates a bearish market, and traders may look for selling opportunities.
- **Neutral Market**: If the price is hovering around the pivot point, it suggests indecision, and traders may wait for a breakout in either direction before making a move.
3. **Quick and Easy Calculation**
Pivot points are easy to calculate and do not require complex tools or software. This makes them accessible for both beginner and experienced traders. Many trading platforms automatically calculate pivot points, so traders can focus on trading rather than complex math.
4. **Helps with Risk Management**
By using pivot points, traders can set stop-loss and take-profit levels more effectively. For instance, if the price reaches a resistance level (R1, R2, R3), it might be wise to set a **take-profit order** near that level. Similarly, if the price is approaching a support level (S1, S2, S3), a trader might decide to place a **stop-loss** just below the support level to minimize losses in case the market moves against them.
5. **Flexibility Across Timeframes**
Pivot points are versatile and can be used on different timeframes—whether you're a **day trader**, **swing trader**, or even a **position trader**. Pivot points help traders with a wide range of trading strategies by identifying critical price levels in both short-term and long-term markets.
6. **Can Be Combined with Other Indicators**
Pivot points work well in combination with other technical analysis tools, such as moving averages, RSI (Relative Strength Index), MACD (Moving Average Convergence Divergence), or candlestick patterns. This combination increases the probability of identifying the right entry and exit points.
7. **Self-fulfilling Prophecy**
Pivot points are widely used by many traders, which means that many market participants pay attention to the same levels. As a result, these levels often become **self-fulfilling prophecies**—meaning that the price will often react to these levels because many traders are placing orders around these points.
8. **Intraday and Long-Term Analysis**
- **Intraday Trading**: For day traders, pivot points are especially useful for identifying **intraday trends** and potential turning points. They help traders decide when to enter or exit trades based on short-term market movement.
- **Long-Term Trends**: Pivot points can also be used in longer timeframes (weekly or monthly) to identify broader market trends and significant reversal zones.
9. **Price Targets**
Pivot points can also be used to set realistic price targets. For example, if the market is above the pivot point, traders might look to target resistance levels (R1, R2, R3) as potential profit-taking levels. Conversely, if the market is below the pivot point, support levels (S1, S2, S3) may be key targets for the downside.
---
### Example of How to Use Pivot Points in Trading:
Let’s assume you’re trading a stock, and you’ve calculated the pivot points for the day based on the previous day’s high, low, and close. Here’s how you might use them:
1. **Price Trading Above Pivot Point**:
If the stock is trading above the pivot point, you might consider it to be in an uptrend. You could look for **buying opportunities** at or near the pivot point (P) or at **support levels (S1, S2, etc.)**.
2. **Price Trading Below Pivot Point**:
If the stock is trading below the pivot point, it could indicate a downtrend. You might then look for **selling opportunities** at or near the pivot point or at **resistance levels (R1, R2, etc.)**.
3. **Price Reversing Near Support/Resistance**:
If the price approaches a significant support or resistance level (S1, R1, etc.) and shows signs of reversal, you could enter a **trade in the opposite direction**, expecting the price to bounce or reverse.
4. **Breakouts**:
If the price breaks above a key resistance level (R1, R2, or R3), it could signal a continuation of the uptrend. Similarly, if the price breaks below a key support level (S1, S2, or S3), it might signal a continuation of the downtrend.
---
### Conclusion:
Pivot points are incredibly useful tools for identifying key support and resistance levels, understanding market sentiment, and making informed trading decisions. They are simple to calculate and apply, flexible across different timeframes, and work well when combined with other indicators. By integrating pivot points into your trading strategy, you can better manage risk, set realistic targets, and ride with the market trend, all of which can significantly enhance your overall trading success.

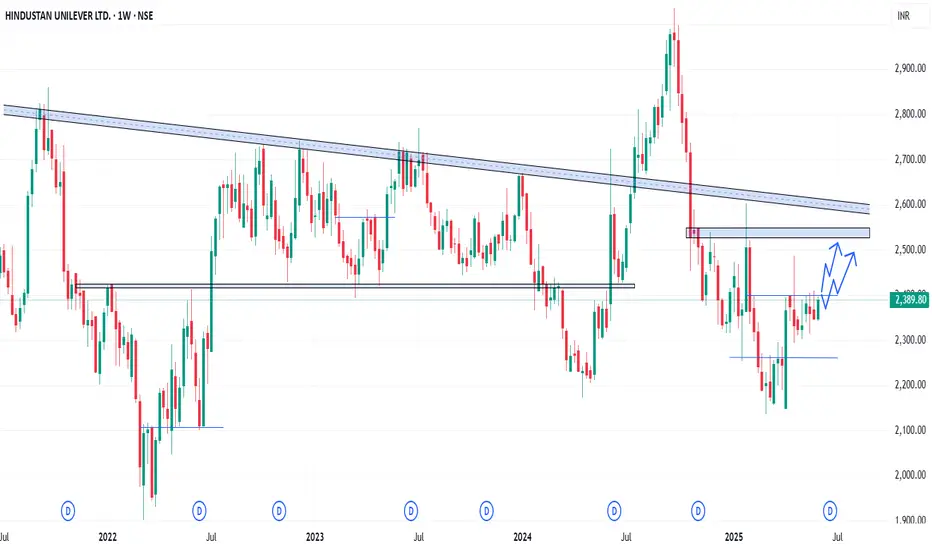
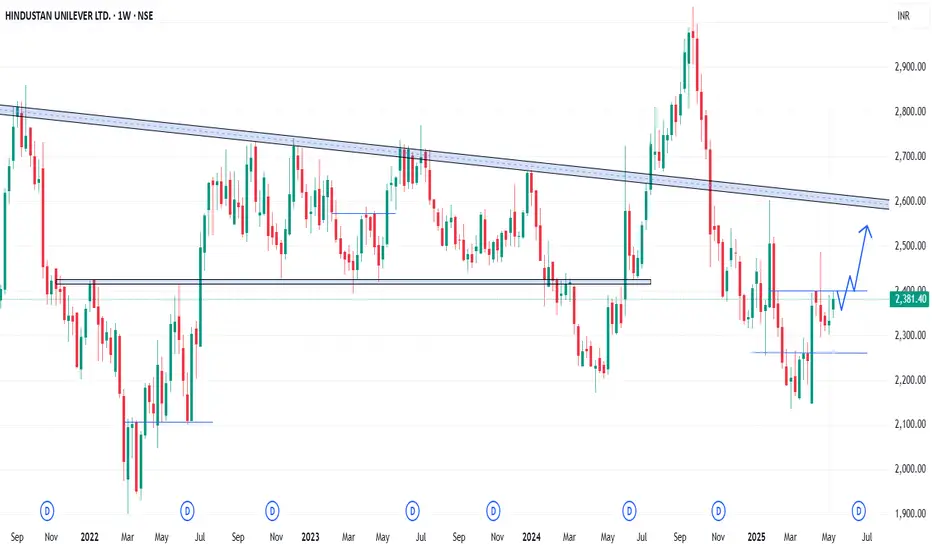
Hindustan UnileverHello & welcome to this analysis
FMCG sector appears to be doing better then other sectors after a very long time with Hindustan Unilever having a large weightage in the sector
Strength signal -
Since 2008 it has never violated the Quarterly Ichimoku Base line nor the Monthly Ichimoku Cloud. Near these support levels it becomes a very attractive value buy. This time also in 2024 it did the same.
After giving a Cup & Handle breakout in the weekly time frame its seen a pullback since October 2024 along with the rest of the market. In the last 3 weeks its gone sideways whereas we have seen other sectors continue to see sharp selling. Once again highlighting that current level is seeing consistent buying support. The pullback appears to have been completed as it bounced back from its rising trend line.
A daily falling wedge breakout has also witnessed a pullback now. As long as it now holds the rising trendline at 2350 it has good potential for upside suggesting a decent low risk high reward set up from short to medium term.
Upside levels one can look out for above 2400 are at 2700 / 3100 / 3300 / 3600
All the best for your trading and investing
My last video on the stock link is shared

HUL- This elephant may danceHUL was trading in a channel shown in chart for last 3 months. It recently showed a breakout from this channel. Current pattern shows retest of the channel. If this is successful, we may see HUL scaling new heights.
Recent budget announcements are in a way beneficial for FMCG sector.
You can keep it in watchlist. If it sustains above channel, investors can buy it with a stoploss at lower end of channel.
This is not a buy/sell recommendation.
This post is only for educational purpose.
Kindly consult your financial advisor before investing.
Use strict stoploss and money management rules.
Happy Trading!!

HUL wait for Pull back and then EnterHUL has just completed the downward Impluse and complex correction (W-X-Y). Although today it showed the strength to move upward, however it looks like there is need for one pullback before the upward Journey.
Chart Speaks everything.
Disclaimer: I am not SEBI registered member, these Ideas meant to be only for Educational Purposes.

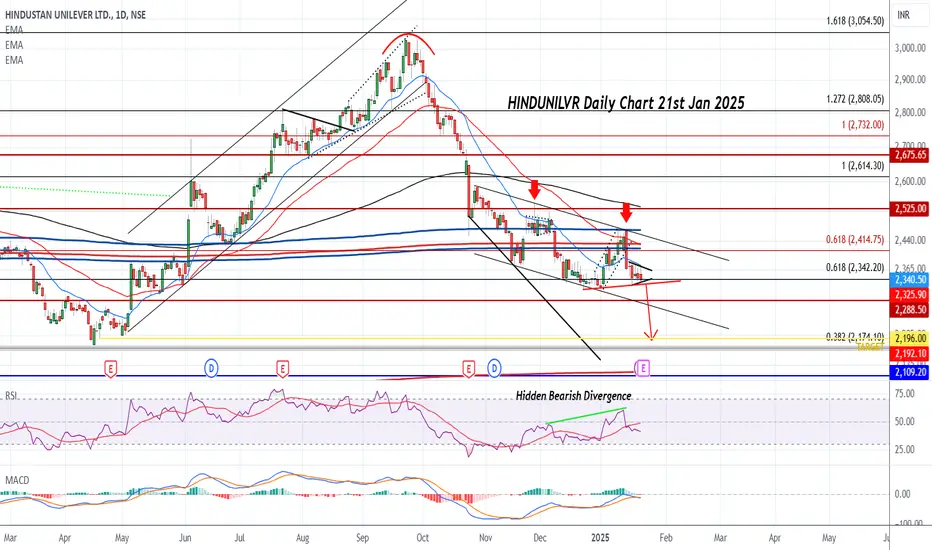
HINDUNILVR can DUMP on Earnings tomorrowAttached: Daily Chart as of 21st Jan 2025
Hidden Bearish RSI Divergence
MACD in Sell and below Zero line
Earnings tomorrow for HUL, if we go by Zomato Earnings which showed Slowdown and Weak Demand for Consumption then Earnings for HUL should also be similar
Price can Crash to Target 2200 and below levels
HUL: Bullish Setup Near Order Block!Order Block at Support:
The price is trading within a marked order block zone (₹2,260–₹2,326), which historically acted as a strong demand area.
This zone aligns with the upward-sloping green trendline, reinforcing support strength.
Bullish Falling Wedge: (Similar to 3 Drive Pattern)
A falling wedge pattern is visible, typically signaling a potential bullish breakout.
The price is currently testing the upper trendline of the wedge.
RSI Trendline Support:
RSI shows a bullish divergence with higher lows while the price forms lower lows.
RSI trendline is intact, indicating strengthening bullish momentum.
Confirmation Checklist:
Ensure a breakout above ₹2,387 with strong volume.
Monitor RSI to stay above 50 for continued bullish momentum.
Look for bullish pattern in minor timeframe for perfect entry and Stop Loss
