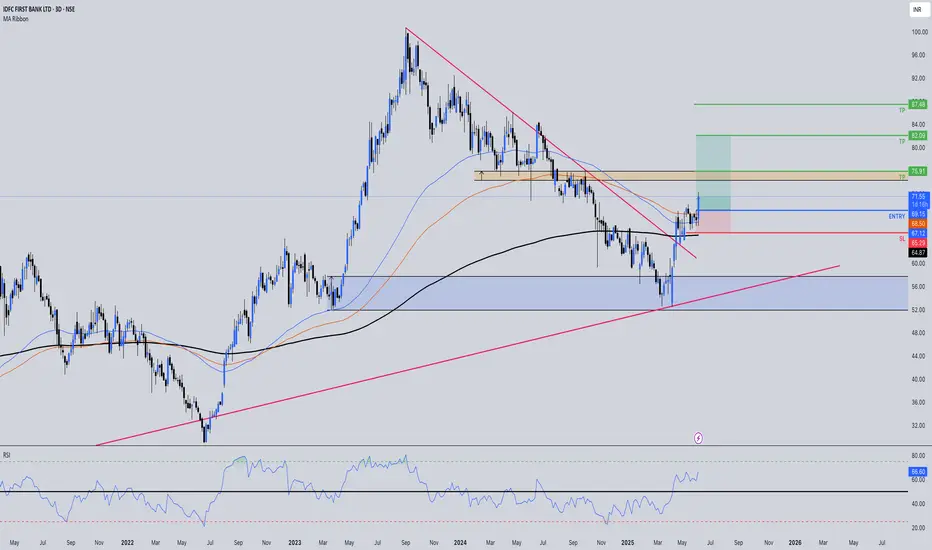
IDFC First Bank Daily Chart – Swing Entry Breakout This daily chart of IDFC First Bank captures a strong primary uptrend from the Daily Demand Zone, followed by a consolidation and pullback that created a higher‑low base above the previous resistance band. Price has triggered a SWING ENTRY from this zone and is now moving inside a defined risk‑rewar
IDFC First Bank Ltd.
No trades
Next report date
—
Report period
—
EPS estimate
—
Revenue estimate
—
1.90 INR
14.90 B INR
433.03 B INR
7.15 B
About IDFC First Bank Ltd.
Sector
Industry
CEO
Vembu Vaidyanathan
Website
Headquarters
Mumbai
Founded
2014
ISIN
INE092T01019
FIGI
BBG007V9TWY1
IPO date
Nov 6, 2015
IDFC First Bank Ltd. engages in the provision of financial and banking solutions. It operates through the following segments: Treasury, Corporate and Wholesale Banking, Retail Banking, Other Banking Business, and Unallocated. The Treasury segment consists of the Bank's investment portfolio; money market borrowing and lending; investment operations; and entire foreign exchange and derivative portfolio of the Bank. The Corporate and Wholesale Banking segment is involved in loans, non-fund facilities and transaction services to corporate relationship not included under Retail Banking, corporate advisory, project appraisal placement, and syndication. The Retail Banking segment constitutes lending to individuals and business banking customers through the branch network and other delivery channels. The Other Banking Business segment refers to revenue from distribution of third-party products. The Unallocated segment consists of items which are considered at an enterprise level. The company was founded by Rajiv Behari Lall on October 21, 2014, and is headquartered in Mumbai, India.
Related stocks

IDFC First Bank – Bullish Directional Trading IdeaLTP: ₹80.28
IDFC First Bank is holding firmly above its major range-breakout zone and continues to show strength on the daily timeframe. Price action remains bullish as long as the stock sustains above the 67–78 accumulation band. The trend structure is higher-high & higher-low, indicating continua

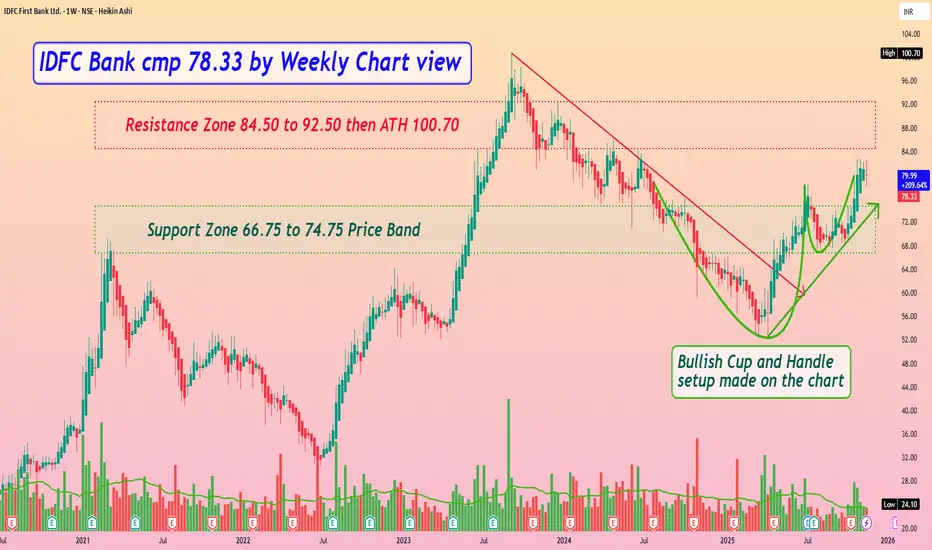
IDFC Bank cmp 78.33 by Weekly Chart viewIDFC Bank cmp 78.33 by Weekly Chart view
- Support Zone 66.75 to 74.75 Price Band
- Resistance Zone 84.50 to 92.50 then ATH 100.70
- Bullish Cup and Handle setup made on the stock chart
- Volumes are in good sync with the average traded quantity
- Rising Support Trendline well sustained and trendi
IDFC FIRST BANK: Reversal Play for 20% upside⚡️Price Analysis:
1️⃣ Price broke the resistance.
2️⃣ Price structure is bullish.
3️⃣ Price trading above EMAs
4️⃣ Strong candle formation.
✨ Key Observations:
➡️ RRR favorable at CMP.
➡️ Price should break the immediate marked resistance to build further strength & momentum.
➡️ Overall banking se
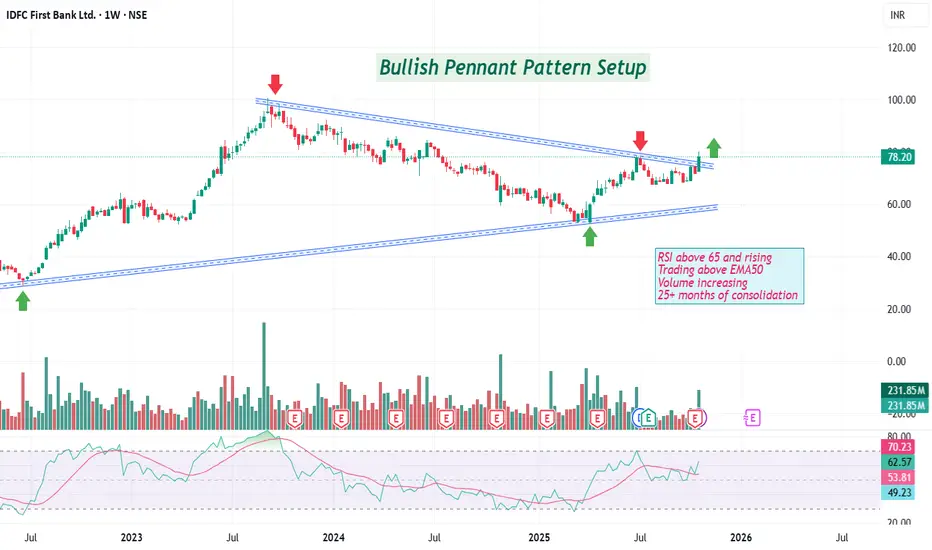
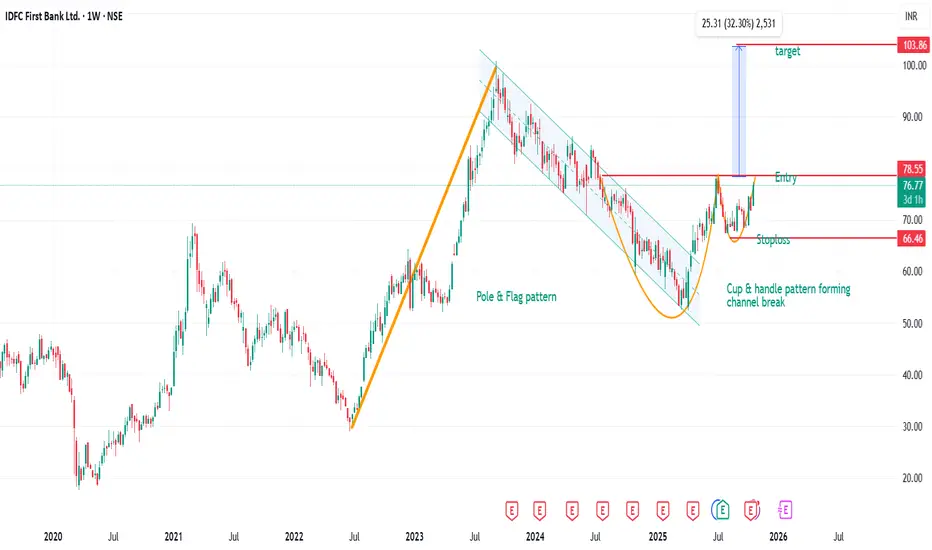
Breakout in IDFC First BankBullish Pennant Pattern Setup
RSI above 65 and rising
Trading above EMA50
Volume increasing
25+ months of consolidation
Disc: For study, not a recommendation. DYOR
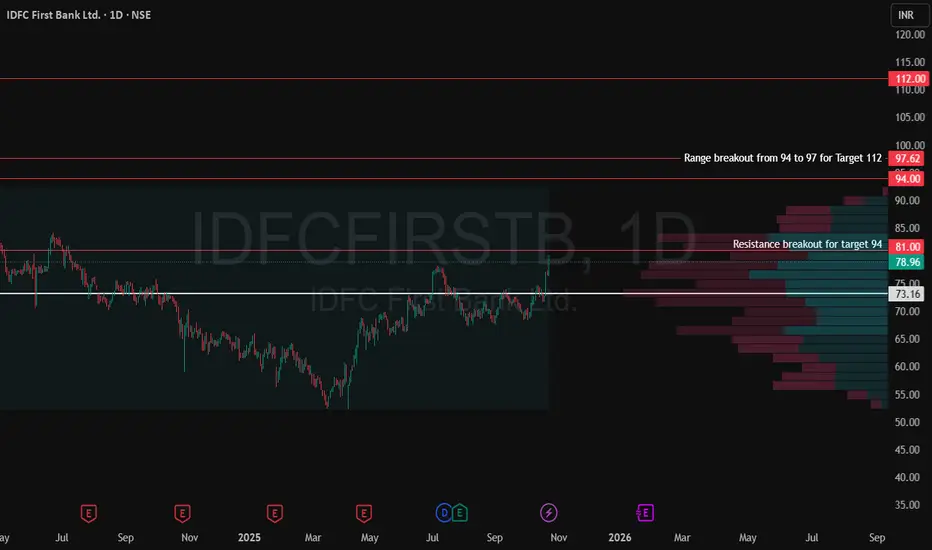
IDFC First (D) - High-Volume Breakout Confirms Bullish ReversalAfter a significant downtrend from its All-Time High in September 2023, IDFC First Bank has been in a clear trend reversal since April 2025. This new uptrend has just been powerfully confirmed by a high-volume breakout, signaling strong buyer commitment.
This Week's Decisive Breakout
The past w

IDFC FIRST BANK Buy, Hold, Sell ReportIDFC First Bank is in a solid uptrend with fundamental strength, but price is close to short-term analyst targets. Hold for long term, Buy on dips, book profits near ₹80–90-112 if trader, but don’t exit completely as future upside is possible if recent growth momentum sustains.
Recent Updates & Fi
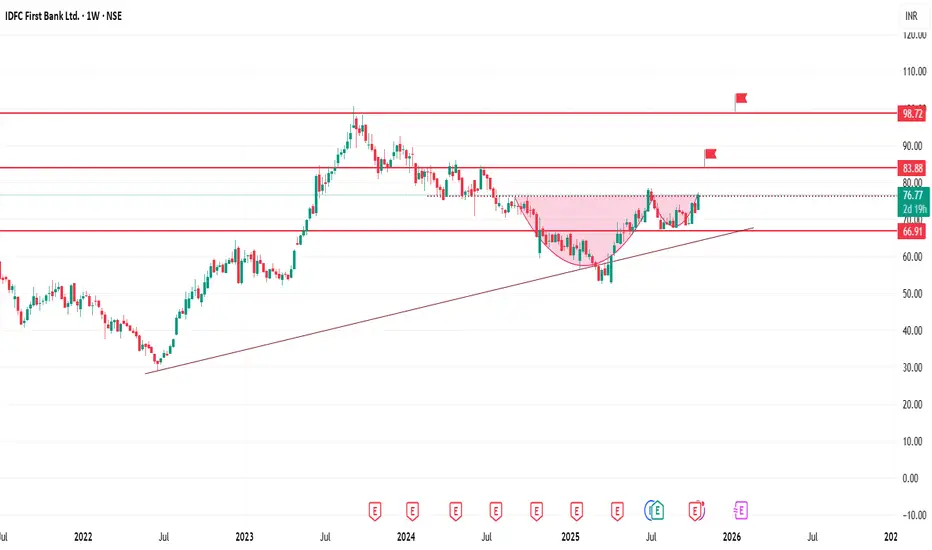
IDFC First Bank - CUP & Handle On weekly TF, Stock has formed Cup & handle pattern. It would reach 83 levels in near term, which is a first resistance. If it sustains the stock may reach to 52 weeks high.
Risk & Possible targets: The depth of Cup is 25%, stock may target +25% on long term. Trend Line acting as a Support.
IDFC First BankIDFC first bank, weekly timeframe, cup and handle pattern, buy for target with strict stoploss as shown in chart.
IDFC First Bank stock is notable for rapid profit growth, expanding business fundamentals, and improving asset quality, but valuation remains expensive compared to peers. Here are
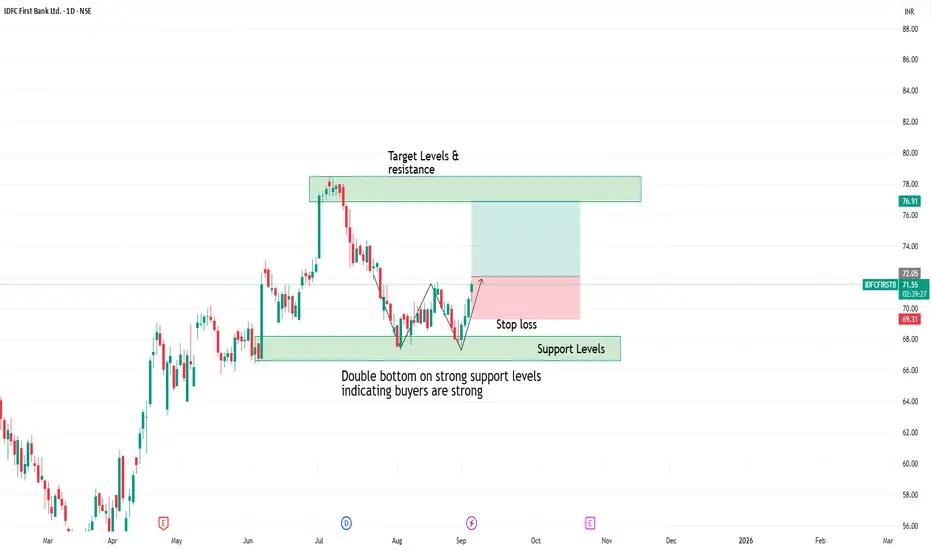
Double bottom created in idfc first bank Double bottom created on support levels
which indicates buyers are strong and accumulating at support levels
one can observe this for upside movement with strict stoploss
See all ideas
Summarizing what the indicators are suggesting.
Neutral
SellBuy
Strong sellStrong buy
Strong sellSellNeutralBuyStrong buy
Neutral
SellBuy
Strong sellStrong buy
Strong sellSellNeutralBuyStrong buy
Neutral
SellBuy
Strong sellStrong buy
Strong sellSellNeutralBuyStrong buy
An aggregate view of professional's ratings.
Neutral
SellBuy
Strong sellStrong buy
Strong sellSellNeutralBuyStrong buy
Neutral
SellBuy
Strong sellStrong buy
Strong sellSellNeutralBuyStrong buy
Neutral
SellBuy
Strong sellStrong buy
Strong sellSellNeutralBuyStrong buy
Displays a symbol's price movements over previous years to identify recurring trends.
Frequently Asked Questions
The current price of IDFCFIRSTB is 80.30 INR — it has increased by 2.27% in the past 24 hours. Watch IDFC First Bank Ltd. stock price performance more closely on the chart.
Depending on the exchange, the stock ticker may vary. For instance, on BSE exchange IDFC First Bank Ltd. stocks are traded under the ticker IDFCFIRSTB.
IDFCFIRSTB stock has risen by 0.32% compared to the previous week, the month change is a 1.17% rise, over the last year IDFC First Bank Ltd. has showed a 22.28% increase.
We've gathered analysts' opinions on IDFC First Bank Ltd. future price: according to them, IDFCFIRSTB price has a max estimate of 100.00 INR and a min estimate of 53.00 INR. Watch IDFCFIRSTB chart and read a more detailed IDFC First Bank Ltd. stock forecast: see what analysts think of IDFC First Bank Ltd. and suggest that you do with its stocks.
IDFCFIRSTB reached its all-time high on Sep 5, 2023 with the price of 100.74 INR, and its all-time low was 17.75 INR and was reached on Mar 24, 2020. View more price dynamics on IDFCFIRSTB chart.
See other stocks reaching their highest and lowest prices.
See other stocks reaching their highest and lowest prices.
IDFCFIRSTB stock is 1.45% volatile and has beta coefficient of 1.01. Track IDFC First Bank Ltd. stock price on the chart and check out the list of the most volatile stocks — is IDFC First Bank Ltd. there?
Today IDFC First Bank Ltd. has the market capitalization of 695.52 B, it has decreased by −3.45% over the last week.
Yes, you can track IDFC First Bank Ltd. financials in yearly and quarterly reports right on TradingView.
IDFC First Bank Ltd. is going to release the next earnings report on Jan 26, 2026. Keep track of upcoming events with our Earnings Calendar.
IDFCFIRSTB earnings for the last quarter are 0.40 INR per share, whereas the estimation was 0.62 INR resulting in a −35.14% surprise. The estimated earnings for the next quarter are 0.71 INR per share. See more details about IDFC First Bank Ltd. earnings.
IDFC First Bank Ltd. revenue for the last quarter amounts to 70.04 B INR, despite the estimated figure of 70.57 B INR. In the next quarter, revenue is expected to reach 73.01 B INR.
IDFCFIRSTB net income for the last quarter is 3.48 B INR, while the quarter before that showed 4.53 B INR of net income which accounts for −23.30% change. Track more IDFC First Bank Ltd. financial stats to get the full picture.
Yes, IDFCFIRSTB dividends are paid annually. The last dividend per share was 0.25 INR. As of today, Dividend Yield (TTM)% is 0.31%. Tracking IDFC First Bank Ltd. dividends might help you take more informed decisions.
IDFC First Bank Ltd. dividend yield was 0.45% in 2024, and payout ratio reached 12.24%. The year before the numbers were 0.00% and 0.00% correspondingly. See high-dividend stocks and find more opportunities for your portfolio.
As of Dec 10, 2025, the company has 42.19 K employees. See our rating of the largest employees — is IDFC First Bank Ltd. on this list?
Like other stocks, IDFCFIRSTB shares are traded on stock exchanges, e.g. Nasdaq, Nyse, Euronext, and the easiest way to buy them is through an online stock broker. To do this, you need to open an account and follow a broker's procedures, then start trading. You can trade IDFC First Bank Ltd. stock right from TradingView charts — choose your broker and connect to your account.
Investing in stocks requires a comprehensive research: you should carefully study all the available data, e.g. company's financials, related news, and its technical analysis. So IDFC First Bank Ltd. technincal analysis shows the buy rating today, and its 1 week rating is buy. Since market conditions are prone to changes, it's worth looking a bit further into the future — according to the 1 month rating IDFC First Bank Ltd. stock shows the strong buy signal. See more of IDFC First Bank Ltd. technicals for a more comprehensive analysis.
If you're still not sure, try looking for inspiration in our curated watchlists.
If you're still not sure, try looking for inspiration in our curated watchlists.