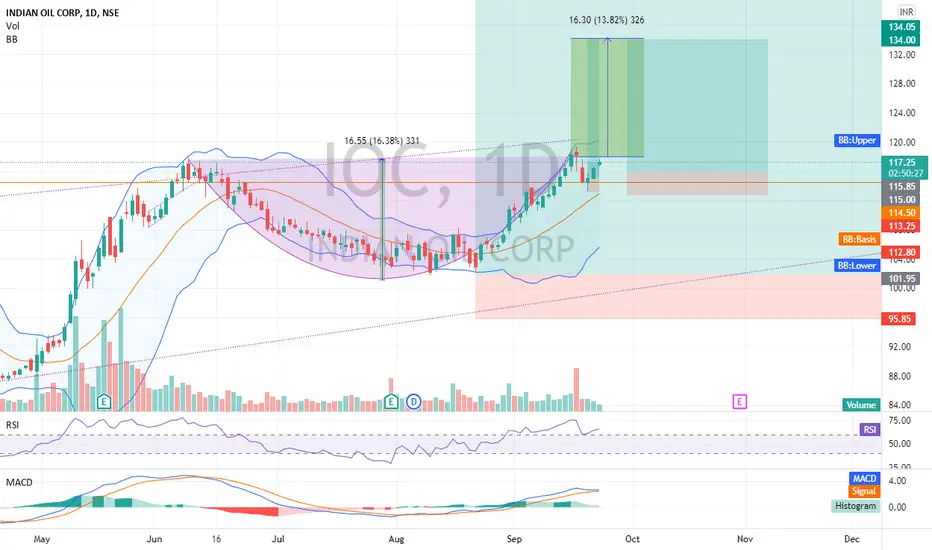
Bullish viewIOC gives positive breakout and crossover it can be buy now with stoploss of 109 and target of 140, 160
IOC trade ideas


IOC STAND ON CRUCIAL LEVELIOC form head and shoulder pattern & it also trade in channel form in dail and weekly chart
when it break the neckline then u should open sell position


suggestion on IOC ioc consolidating below 200 DMA
if it given closing below red trend line find for exit
watch for fresh position once find bottom

IOC A longer term trendline BropkenIOC has similar patterns as other oil stocks....
Looking at chart ,it has broken long term trendline of 7 years and going up.....
Even Cup and handle formed....

Indian Oil Corporation Ltd - 11.02.2022Indian Oil Corporation Ltd - 11.02.2022
The stock is trading @ 122 levels
There is a HAMMER in Weekly Charts
There is a ENGULFING BULL in Daily Charts
There is a DOJI in Hourly Charts
RSI is 53 in Weekly Charts
The prices are at EMA
Let the prices go above 124.60; one can initiate a BUY position with Support @ 117.15
Watch out for the price action

Im Bullish on IOC For next weekim Bullish on IOC next week Because it has broken its trend line and it is sustaining above the trend line

IOC is near to Strong support zone. Can accumulate for long termIOC is near to Strong support zone. Can accumulate for long term
RSI is also showing up trend


IOC Long Trade With Proper ReasoningHi
So here we are again so we will again long Indian Oil Corporation with amazing Risk Reward Ratio. And It will also provide dividend of Rs.4 with Ex date of 9th Febuary. So I will recommend buying or if you already bought it then please don't sell it. Thanks and make sure to follow and like the post.
Bye


IOCIOC trend is so bullish in weekly timeframe volumes are spiking up buyers are on peak a good short or long position can be considered in this stock

Long term bullish candle trendline formed in IOC NSE:IOC
An extremely bullish candle is formed when a trendline is drawn in long term chart patterns in state owned IOCL. People investing on EVs should understand that power stations for EVs will be set by these OMC's. Stock is available at P/E of just 4.

INDIAN OIL CORPORATION INDIAN OIL CORPORATION
1- making perfect cup and handle formation
2- 125-127 is the demand and supply zone that has played its role many a time looks at the chart for more clues
3- if we consider harmonics as well in this chart it is making perfect w pattern
consider the leg of xb as 0.50 (though on the chart it is 0.531 , we can consider it as 0.50)
4 so that targets are coming close to 137-140 range
5 Most important with recent swing to recent swing high if consider as per the Fibo also
it is has done its 0.50 retracement which is sign a healthy retracement
so putting all the points in consideration i am personally bullish in these stocks - only the closing above 127
all the above explanations are as per my understanding
Note:-
I am not a SEBI Registered analyst. we do not recommend andy buy or sell, in case you wish to do so consult a financial advisor first
we shall not be responsible for any of your losses and profits
Do comment on the chart and let me know in case you wish to learn more on charts
Thank you

IOC: Chart set up, Result, Dividend and important levelsIOC
Last time when the stock was at 117, we had given a Buy for IOC with target of 126 / 132
The stock retraced exactly from 126 odd levels and is now taking support at 50 day EMA sub 120 odd levels
The stock is showing signs of strength and may be poised for it's 2nd target of 132 and could possibly even test the highs of 141 in medium term
Above 142, Doors would open up further for target of 166 / 172 in Longer term
200 day EMA support is at 114 odd levels
Note: Result is on Jan 31, 2022 and there is a possibility of Dividend announcement.
Take care & safe trading...!!!
Disclaimer
- The view expressed here is my personal view
- Past performance is not a guarantee for future predictions
- Use this for educational purpose
- Any decision you take, you need to take responsibility for the same
- It's your hard earned money. Treat it wisely
- Trade / Invest keeping in mind your trading style, goals and objectives, time horizon & risk tolerance
- if trading in F&O, understand that F&O trading involves risk
- Do take proper risk management measures
- Do your own analysis and consult your financial adviser if need be

Long #IOC for TGT - 140, Swing Trade- Reason- 100 DMA supportLong #IOC for TGT - 140, Swing Trade- Reason- 100 DMA support


Trend line break out : IOCDear Friends
Watch trend line break out of IOC . if IOC break and sustain 126 level then it will touch 130( Target 1) and 135 (Target 2)
Wait for 126 level..
All level mentioned on chart for your reference.
Regards
Kirit Chavda

[ INTRADAY ] IOC LONG BETrisk: Reward ratio is 1: 2
Rest as per Charts
********
Note -
One of the best forms of Price Action is to not try to predict at all. Instead of that, ACT on the price. So, this chart tells “where” to act in “what direction. Unless it triggers, like, let’s say the candle doesn’t break the level which says “Buy/Sell if it breaks”, You should not buy/sell at all.
=======
I use shorthands for my trades.
“Positional” - means You can carry these positions and I do not see sharp volatility ahead.
“Intraday” -means You must close this position at any cost by the end of the day.
=======
Always follow a stop loss.
In the case of Intraday trades, it is mostly the “Low/High of the Candle”.
In the case of Positional trades, it is mostly the previous swings
********

IOC : Indian Oil Corporation Ltd. BuyIndian Oil Corp. Ltd is India's flagship national oil company and downstream petroleum major.
CMP: 123.30
Target: 132-135+
Now on near support 121.30 it may retraced as per cup and handle strategy. and go for up to 132 to 135 . also given day breakout on neckline.
Right time to buy.
Feel free to share your feedback and queries.
If you want to know about your stock please mention in comment.
