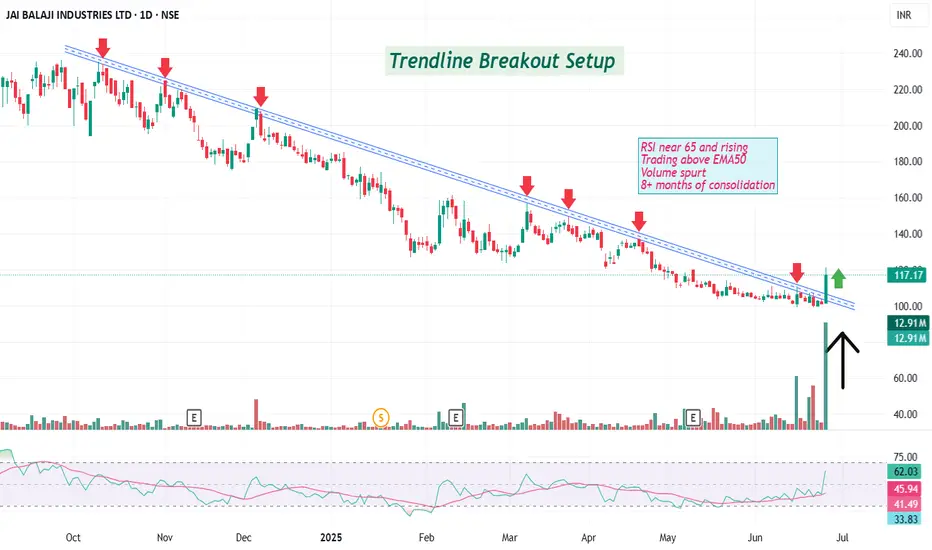
Trendline Breakout in Jai Balaji IndCan we see a strong reversal in Jai Balaji Ind?
A classic Trendline Breakout after Long Consolidation may be on the cards.
Breakout screener:
✅ RSI near 65 and rising
✅ Above EMA50
✅ Massive Volume Spurt
✅ 8+ months of consolidation
Disc: for study, not a recommendation. DYOR
JAIBALAJI trade ideas
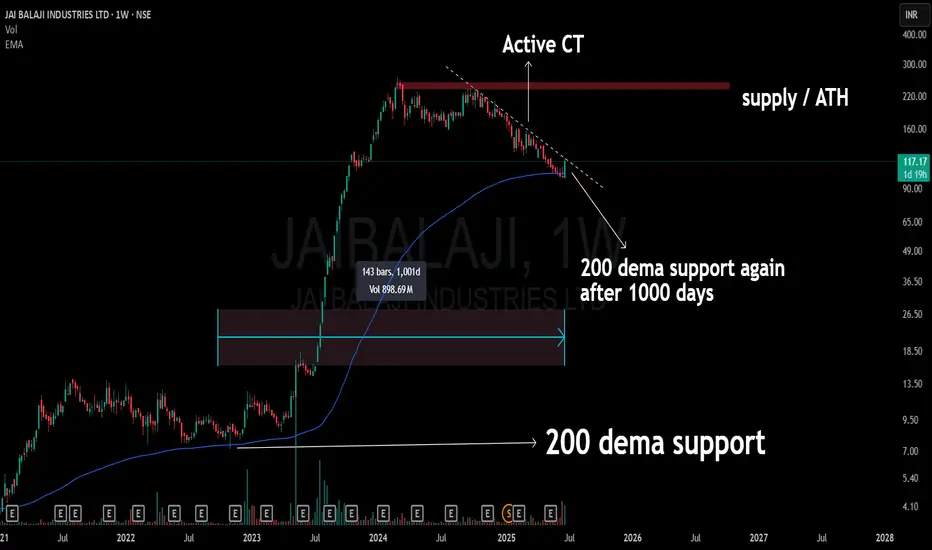
200 Dema Touched After 1000 Days !! 🔵 Stock: JAI BALAJI (Weekly)
🔥 Support Revisit: Back to the 200 DEMA after 1000 days
A level that once acted as the launchpad.
Current structure shows an active compression trend (CT) right into this long-term dynamic support.
The chart also aligns below a major supply zone / ATH band, keeping the broader context in check.
📉 No prediction. No call. Just structure, levels, and time-tested zones doing the talking.
JAIBALAJI - VCP Chart Pattern FormationThe stock is forming a VCP pattern, which is a bullish continuation indicator suggesting potential upside.
There is also a significant increase in volume during the handle formation, confirming buying interest.
CMP - 1152
Entry: Above ₹1,175 (breakout level).
Target 1: ₹1,300
Target 2: ₹1,400
Target 3: ₹1,535
Stop-Loss: ₹1,065
Disclaimer: The stock information shared here is not a recommendation to buy, sell, or hold. It reflects my own analysis and is intended solely for educational purposes. Any actions you take based on this information are your responsibility, and the admin of this channel is not liable for any financial gains or losses. Please consult a financial advisor before making any investment decisions. I am not a SEBI-registered advisor.

JAI BALAJI IND is gave B3 buy signal on daily timeframe Jai Balaji IND is giving breakoutnof trend line and giving B3 buy signal on daily timeframe.
Weekly timeframe is giving B2 buy signal.
Keep weekly SL of 850 for good upside potential.

jaibalaji longbreaking darwas box and taken support fromthe monthly low. Good volume and near BO level

JAI BALAJI Moving up after consolidationJAI BALAJI Moving up after consolidation
stock is consolidating for long time, today shown good green with good volume and about to break near resistance.
above resistance close on next day will ensure up move for few session till next resistance

JAI BALAJI Breakout after Long consolidation Jai Balaji - after 1 month of consolidation stock is trying to make breakout.
weekly support is placed below 830, daily support is placed below 870.
note: Stock is illiquid. Analyze before taking it.

Go LONG in JAI BALAJI INDUSTRIES !!!Target Mentioned on the chart
Fundamentally strong
Undervalued has huge potential


JAI BALAJI Company has reduced debt.
Company has delivered good profit growth of 51.1% CAGR over last 5 years
Promoter holding has increased by 2.78% over last quarter.
Sponge Iron
Pig Iron
Ferro Alloys
Alloy Carbon & Mild Steel Billets
Alloy Carbon & Mild Steel Round
TMT Bars
Ductile Iron Pipes
Power

Jai Balaji Industries Limited (EDUCATIONAL PURPOSE ONLY)There is no guarantee in stock market and Nothing over week
STOCK TO STUDY (EDUCATIONAL PURPOSE ONLY, NOT BUY OR SELL RECOMMENDATIONS)
Jai Balaji Industries Limited
Target: RS 1055
CMP: RS 1002.70
ENTRY RANGE: 990-1012
STOP LOSS: RS 985
Disclaimer: I am not Sebi Registered.

JAI BALAJI INDMarket Cap: ₹ 10,048 Cr.
Stock P/E: 26.0
ROCE: 18.3 %
Company has reduced debt.
Company has delivered good profit growth of 21.1% CAGR over last 5 years
Promoter holding has increased by 1.29% over last quarter.
Symmetrical Triangle Pattern Breakout on Daily Time Frame
52 was our Dip Level Buying almost from 12th April 23
Fresh Entry: 645
Target: 800, 900 ++
SL: 560 CB
Remark: Short Term
Disclaimer: Strictly for Educational and Learning purpose.

JaiBALAJI - What Gains WOW N8QJaiBALAJI - What Gains WOW N8Q
Can't comment, what is hapenning in this stock, too much return, may further breakout as well.

Jai Balaji IndNet Sales at Rs 1,546.63 crore in September 2023 up 12.94% from Rs. 1,369.38 crore in September 2022.
Quarterly Net Profit at Rs. 201.55 crore in September 2023 up 851.69% from Rs. 21.18 crore in September 2022.
EBITDA stands at Rs. 241.07 crore in September 2023 up 257.41% from Rs. 67.45 crore in September 2022.
Jai Balaji Ind EPS has increased to Rs. 12.79 in September 2023 from Rs. 1.74 in September 2022.Jai Balaji Ind shares closed at 596.30 on October 19, 2023 (NSE) and has given 1,101.01% returns over the last 6 months and 1,333.41% over the last 12 months.

JAI BALAJIThe Co has a diverse portfolio of value-added products including DRI (Sponge iron), Pig iron, Ferro Alloys, Alloy and Mild Steel Billets, Reinforcement Steel TMT Bars, Wire Rods, Ductile Iron Pipes, and Alloy and Mild Steel Heavy Rounds.

JAI BALAJI - 165% RETURNS!!!BUY - JAI BALAJI IND
CMP - Rs. 80
Target - 1: Rs. 135
Target - 2: Rs. 210
.
.
Technicals - Bullish Triangle BO
.
This is just a view by an expert analyst, please invest at your own risk.
.
Follow me for more!

JAI BALAJI - Swing TradeEntry: 80.1
Target: 99
SL: 75.5
EMA's : EMA 10 > EMA 21 > EMA 50 > EMA 150 > EMA 200.
Price moved up about 90% + and consolidated for & weeks.

Jai Balaji Industries Limited - Long Setup, Move is ON...#JAIBALAJI trading above Resistance of 79
Next Resistance is at 105
Support is at 54
Here is previous chart:
Chart is self explanatory. Entry, Resistances and Support are mentioned on the chart.
Disclaimer: This is for demonstration and educational purpose only. This is not buying or selling recommendations. I am not SEBI registered. Please consult your financial advisor before taking any trade.

Breakout in Jai Balaji Industries Limited...Chart is self explanatory. Levels of breakout, possible up-moves (where stock may find resistances) and support (close below which, setup will be invalidated) are clearly defined.
Disclaimer: This is for demonstration and educational purpose only. This is not buying or selling recommendations. I am not SEBI registered. Please consult your financial advisor before taking any trade.

High risk high income stock idea - JAIBALAJIThis stock has formed a good chart pattern. Fundamentals are improving too. Small investment can do in this stock.

JAIBALAJI BREAKOUTJAIBALAJI BREAKOUT OF TRENDLINE.
As you can see clearly from the above trendline pattern that it has given a clear cut breakout from it with blasting volumes in the stock giving a strong buy signal.

Trendline BreakoutPlease look into the chart for a detailed understanding.
Consider these for short-term & swing trades with 2% profit.
For BTST trades consider booking target for 1% - 2%
For long-term trades look out for resistance drawn above closing.
Please consider these ideas for educational purpose

Expecting Breakout ✌✌✌This scrip is expected to give breakout in the coming days. So traders keep on your radar to catch the momentum. Thanks to all 🙏🙏🙏
