Part 11 Trading Master ClassIron Condor – Best for Sideways Markets
Perfect for low-volatility environments where price stays in a range.
How it works
You create:
A bull put spread (below market)
A bear call spread (above market)
You earn net premium from both sides.
When to use
Markets are consolidating.
You expect low volatility and no big moves.
Risk and reward
Risk: Limited, predefined.
Reward: Limited to net premium collected.
Example
Nifty trading at 22,000
Sell 21,800 PE – Buy 21,700 PE
Sell 22,200 CE – Buy 22,300 CE
You collect total premium and profit if Nifty stays between 21,800–22,200.
Trade ideas

JSPL: Steeling Up for a Breakout MoveNSE:JINDALSTEL
======================================
1. Technical Analysis (Chart)
======================================
Trend: Strong Bullish (Higher Highs, Higher Lows).
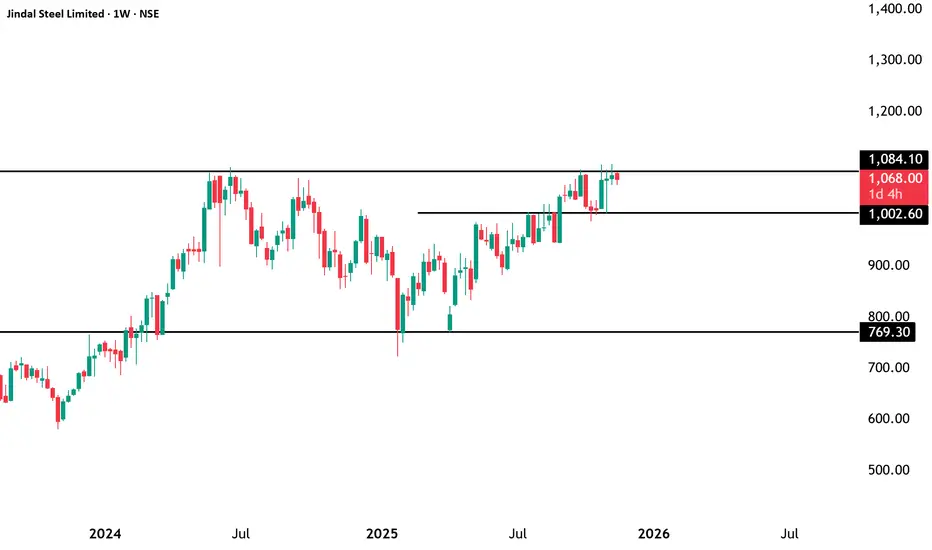
Breakout Zone: ₹1,084. A weekly close above this enters uncharted territory (Blue Sky Zone).
Immediate Support: ₹1,002. The trend remains positive as long as the price holds above this.
Major Support: ₹770. Best accumulation zone for long-term investors.
Price Action: Currently consolidating at the top. A "Red Candle" at resistance suggests minor profit booking before the next leg up.
======================================
2. Fundamental Analysis (Q2 FY26 Data)
======================================
Recent Earnings: Weak. Net Profit fell ~26% YoY to ₹635 Cr due to higher input costs, though Revenue was stable at ₹13,505 Cr.
Valuation: Expensive. Trading at a P/E of ~39x (vs Industry ~20x). The market is pricing in future growth, leaving little room for error.
Margins: Compressed to ~17-18% (down from ~24%).
Debt: Controlled. Net Debt reduced to ~₹14,156 Cr, showing good balance sheet discipline despite heavy Capex.
======================================
3. Future Growth (The "Why" to Buy)
======================================
Angul Expansion: Capacity recently jumped from 6 MTPA to ~12.6 MTPA. This volume doubling is the key revenue driver for FY26-27.
Product Shift: Moving to Flat Steel (Hot Strip Mill). This commands higher margins than construction steel.
Raw Material Security: Owns captive coal mines (Utkal-C), protecting it from global coal price shocks better than peers.
2030 Vision: Aiming for 25 MTPA capacity, targeting to be the world’s largest single-location steel plant.
⚠️ Disclaimer:
This analysis is for educational and informational purposes only.
We are not SEBI-registered analysts or advisors.
This is our personal view based on available data and market trends.
Please consult your SEBI-registered investment advisor before making any investment or trading decisions.
You are solely responsible for any financial decisions you make based on this content.
========================
Trade Secrets By Pratik
========================
JINDALSTEL 1 Week Time Frame 🔍 Key Levels
Approximate current price: ~ ₹1,066 – 1,084.
Important support zones:
~ ₹988 – ₹998 (weekly major support)
Deeper support: ~ ₹973 – ₹975
Key resistance zones:
Near ~ ₹1,022 – ₹1,038 (weekly resistance area)
Higher resistance: ~ ₹1,047 – ₹1,068
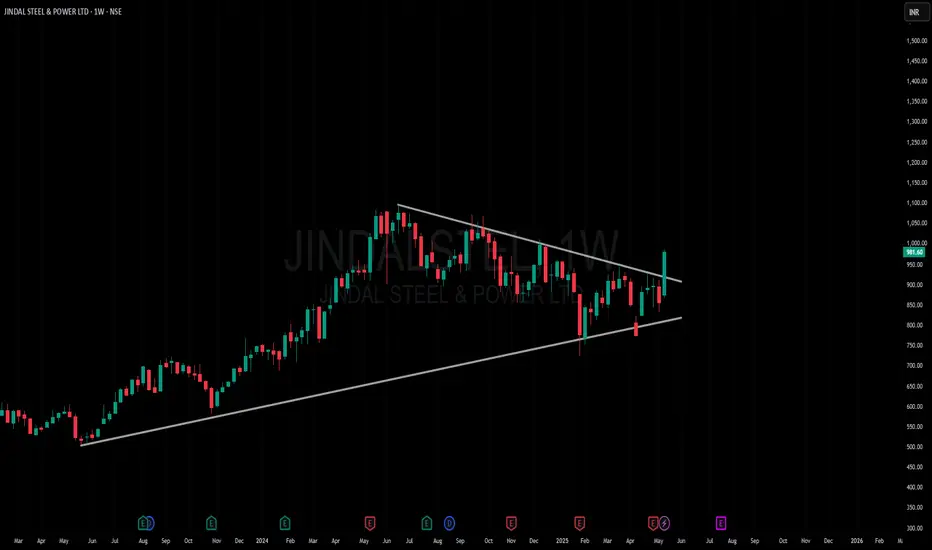
JINDALSTELJINDALSTEL head and shoulder pattern forming entry only on weekly closing basis as shown in chart, use strict stoploss

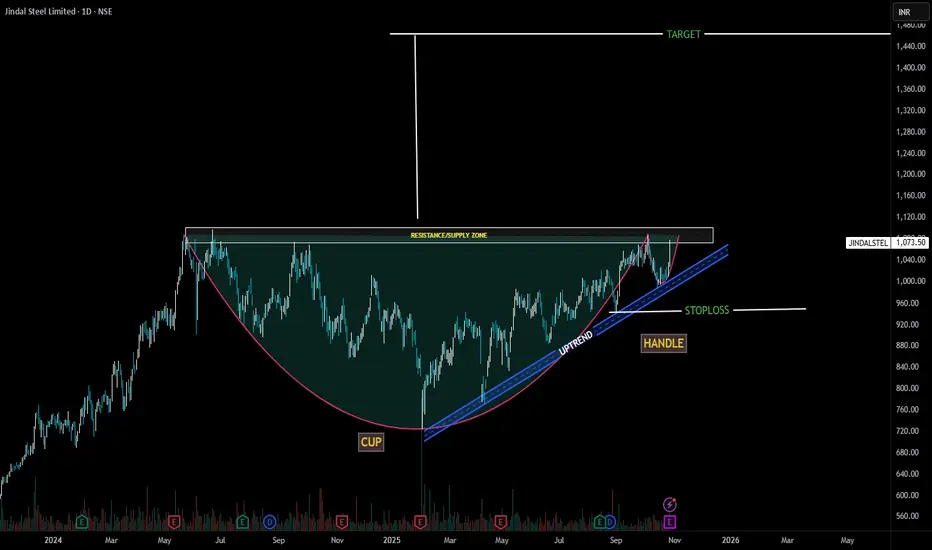
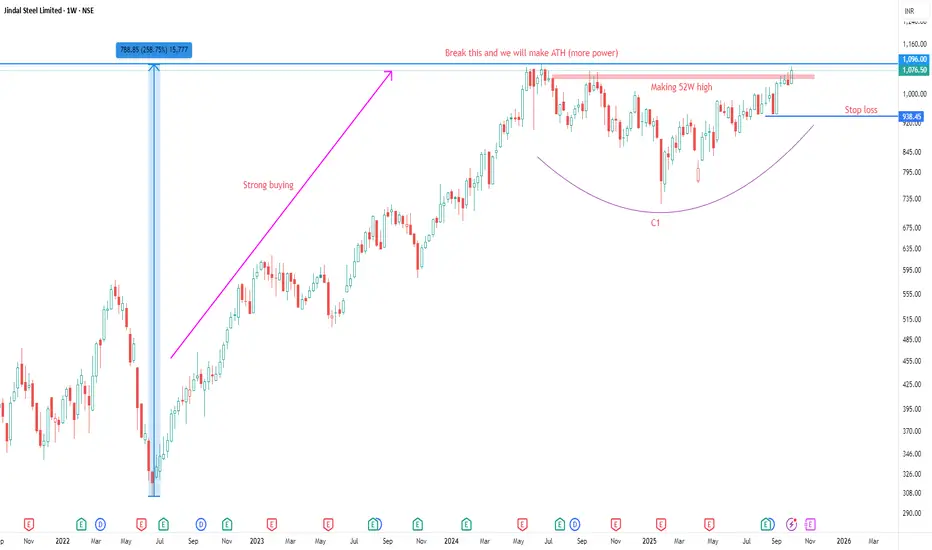
JINDAL STEEL LIMITEDCup Formation:
The left side shows a clear decline followed by a rounded bottom and a steady recovery forming a "U" shape — ✅ valid cup structure.
Volume tends to decrease during the cup and increase on the right side — which seems consistent here.
Handle Formation:
The handle is shorter in duration and has a mild retracement, not breaking the uptrend channel — ✅ valid handle structure.
The breakout from the handle appears to be approaching the resistance/supply zone — this is typically where confirmation is needed.
Resistance/Supply Zone:
The horizontal resistance around ₹1,100 is correctly marked. A breakout above this zone with strong volume would confirm the pattern — ✅ correct identification.
🎯 Target Projection
The target has been drawn correctly using the height of the cup added to the breakout level.
Based on the chart, the target near ₹1,400–₹1,450 seems technically justified (around a 30–35% upside).
⚠️ Stop-Loss & Risk Management
The stop-loss zone near ₹950 aligns well with the handle’s lower trendline and the uptrend channel support — ✅ logical and well-placed.
This stock is at support and resitance level may give 6 % moveStock will likely experience a significant move next week.
Here's a trading plan:
* **Upside Trade:** If the price rises above ₹1010, initiate an upward trade. Set a target price of ₹1079 and place a stop-loss at the recent swing low.
* **Downside Trade:** If the price falls below ₹1010, initiate a downward trade. Set a target price of ₹943 and place a stop-loss at the recent swing high.

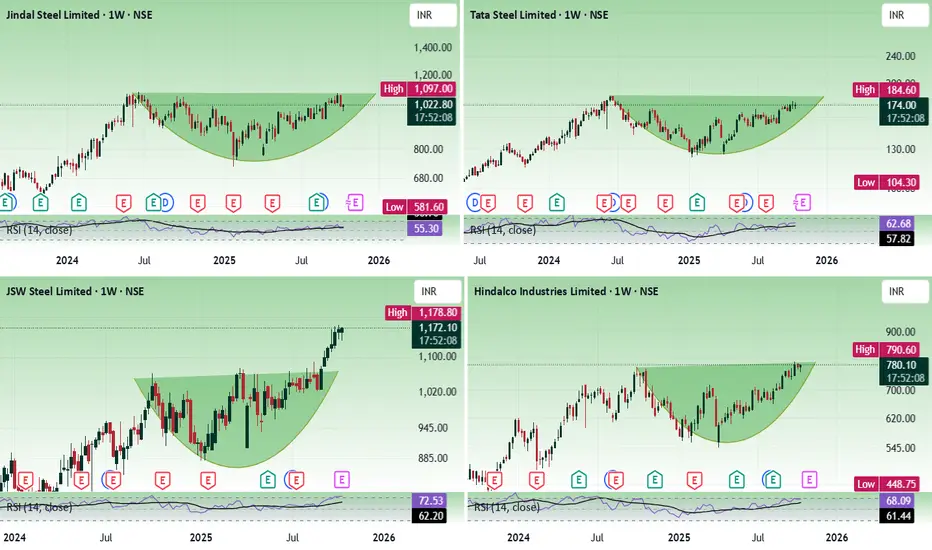
Metals - Ready to shine?As Nifty is gaining bullish strength, I took the metal sector stocks to do an analysis and found a similar pattern formation. The pattern I found is a rounding bottom, which is a bullish pattern.
Among the stocks, tatasteel, JSW steel, Jindal steel and Hindalco, JSW steel is showing more strength as it has already broken the rounding bottom resistance and is moving up.
JSW steel - has support at 1120 zone and resistance at 1200 - 1220 zone.
Tatasteel support is at 160 and resistance is at the 178 - 180 zone.
Jindal steel - support is at 980 -1000 zone and resistance is at the 1100 zone.
Hindalco - support is at 720 and resistance is at 790 - 810 zone.
There is no buy or sell levels. Just an observation about the similarity in stocks.
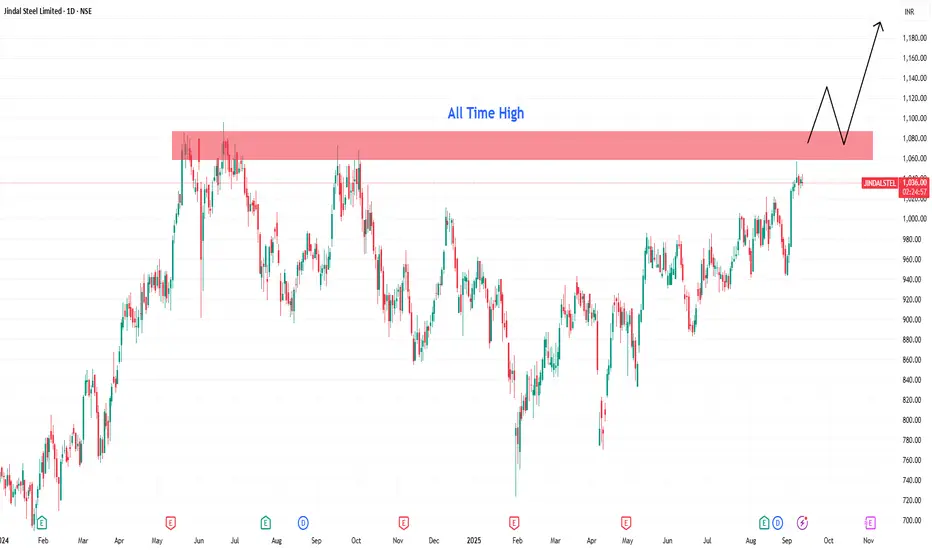
JINDALSTEEL: Classic Breakout & Retest Setup!1. Price is rejecting from the 17years ath level acting as very strong support.
2. EMAs are also supporting the strength.
3. Overall RRR looks decent enough.
⚠️ Disclaimer: This is NOT a buy/sell recommendation. This post is meant for learning purposes only. Views are personal. Please, do your due diligence before investing.⚠️
💬 What are your thoughts on this share it in the comments below. ✌️
🔥 Happy Trading!✅🚀

JINDALSTEL 1 Day Time Frame 📈 Intraday Support & Resistance Levels
Resistance Levels:
₹1,078.87
₹1,071.93
₹1,063.47
Support Levels:
₹1,056.54
₹1,048.07
₹1,041.13
These levels are derived from pivot point calculations and are useful for short-term trading decisions.
🔍 Technical Indicators
Relative Strength Index (RSI): Currently at 39.78, indicating a bearish condition.
MACD: At -3.67, suggesting a bearish trend.
Moving Averages: The stock shows a strong sell outlook based on moving averages ranging from MA5 to MA200, with 2 buy signals and 10 sell signals.
JINDAL STEEL LTD ANALYSISFOR LEARNING PURPOSE
JINDAL STEEL LTD- The current price of JINDAL STEEL LTD is 1076.50 rupees
I am going to buy this stock because of the reasons as follows-
1. Its making 52W high with some good volume (sign of strength)
2. It got a great buying force and moved up by 250% in 2022-2023 (which shows smart money)
3. It is showing better relative strength as it stood strong in volatile times including last few weeks.
4. The risk and reward is favourable. The good part- The stock is not extended.
5. The stock can be a good turnaround story if it does great in coming time.
6. The stock has got a good catalyst and that is- Promoters have increased their stake in this stock.
7. Another good part- The sector is looking bullish. Metal sector is on the verge of making ATH
I am expecting more from this in coming weeks
I will buy it with minimum target of 35-40% and then will trail after that.
My SL is at 938.45 rupees
I will be managing my risk.
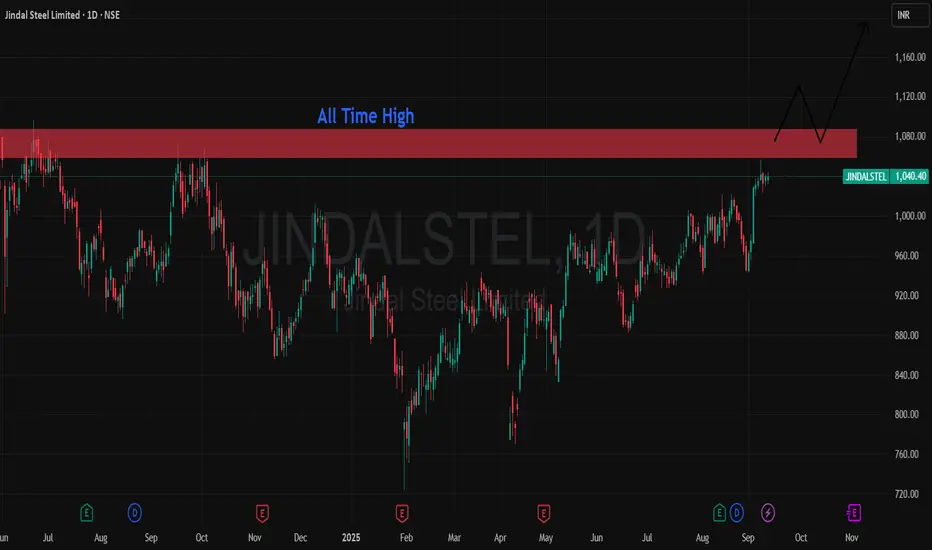
Jindal Steel: Q1 Turnaround Fuels Technical Breakout SetupTechnical Analysis
Jindal Steel has demonstrated an exceptional super bullish rally spanning the past decade, establishing itself as a market leader. However, since 2024, the stock encountered formidable resistance at the 1050-1100 zone, creating a critical supply area that has tested multiple times.
The game-changing catalyst arrived with the announcement of stellar Q1 FY26 results in August 2024, showcasing remarkable operational turnaround. These super positive quarterly numbers provided the momentum needed to challenge the stubborn resistance zone once again.
Currently trading at ₹1,039, the stock sits just below the crucial 1050-1100 supply zone. A decisive breakout above this range with strong volume confirmation would mark a significant technical milestone, transforming previous resistance into robust support.
Entry Strategy: Enter on sustained breakout above ₹1,100 with volume confirmation, ensuring bullish candlestick patterns emerge.
Targets:
Target 1: ₹1,150
Target 2: ₹1,200
Target 3: ₹1,250
Stop Losses:
Critical Stop: ₹1,050 (supply zone breakout level)
If the supply zone sustains and market fails to hold above these levels, no more expectations on this stock.
Q1 FY26 Financial Highlights (vs Q4 FY25 & Q1 FY25)
Total Income: ₹12,294 Cr (↓ -6.7% QoQ from ₹13,183 Cr; ↓ -9.7% YoY from ₹13,618 Cr)
Total Expenses: ₹9,289 Cr (↓ -14.9% QoQ from ₹10,922 Cr; ↓ -13.8% YoY from ₹10,779 Cr)
Operating Profit: ₹3,006 Cr (↑ +32.9% QoQ from ₹2,262 Cr; ↑ +5.9% YoY from ₹2,839 Cr)
Profit Before Tax: ₹2,018 Cr (↑ +2,703% QoQ from ₹72 Cr; ↑ +8.6% YoY from ₹1,859 Cr)
Profit After Tax: ₹1,498 Cr (Turnaround from ₹-304 Cr QoQ; ↑ +11.8% YoY from ₹1,338 Cr)
Diluted EPS: ₹14.65 (↑ +540% QoQ from ₹-3.33; ↑ +11.5% YoY from ₹13.14)
Fundamental Highlights
Jindal Steel delivered a spectacular operational turnaround in Q1 FY26 with PAT surging to ₹1,498 crore, marking an impressive 11.8% YoY growth and complete recovery from Q4 FY25 losses. The dramatic quarterly improvement showcases superior cost management with expenses declining 14.9% while operating profits jumped 32.9%.
Market cap stands at ₹1,05,635 crore (up 7.49% in 1 year) with strong promoter holding of 62.4% indicating management confidence. The company maintains diversified operations across steel, power, mining and infrastructure sectors providing business stability.
Operating margin expansion from 20.8% in Q1 FY25 to 24.5% in Q1 FY26 demonstrates exceptional operational efficiency improvements. The integrated steel-to-power business model offers competitive advantages and revenue diversification benefits.
India's steel sector momentum provides strong tailwinds with market projected to grow from $102.67 billion in 2024 to $166.96 billion by 2030 at 8.28% CAGR. Infrastructure boom and government initiatives support sustained steel demand growth prospects.
Cost optimization excellence reflected in 13.8% YoY expense reduction while maintaining operational capabilities, showcasing management's focus on profitability enhancement. The company's strategic positioning in key infrastructure segments aligns with India's growth trajectory.
EPS improvement from negative territory to ₹14.65 validates the operational turnaround strategy. Strong balance sheet fundamentals and debt management support the technical breakout thesis for sustained momentum.
Conclusion
Jindal Steel's remarkable Q1 FY26 turnaround with 11.8% YoY PAT growth and operational margin expansion creates compelling technical setup at the 1050-1100 resistance zone. The company's integrated business model and sector tailwinds from India's infrastructure boom provide strong fundamental backing. Critical breakout above ₹1,100 with volume confirmation could unlock significant upside to the ₹1,250 target zone. Support at ₹1,050 breakout level must sustain for continued bullish trajectory.
Disclaimer: lnkd.in
Jindal Steel: Q1 Turnaround Fuels Technical Breakout Setup🔍 Technical Analysis
Jindal Steel has demonstrated an exceptional super bullish rally spanning the past decade, establishing itself as a market leader. However, since 2024, the stock encountered formidable resistance at the 1050-1100 zone, creating a critical supply area that has tested multiple times.
The game-changing catalyst arrived with the announcement of stellar Q1 FY26 results in August 2024, showcasing remarkable operational turnaround. These super positive quarterly numbers provided the momentum needed to challenge the stubborn resistance zone once again.
Currently trading at ₹1,039, the stock sits just below the crucial 1050-1100 supply zone. A decisive breakout above this range with strong volume confirmation would mark a significant technical milestone, transforming previous resistance into robust support.
Entry Strategy: Enter on sustained breakout above ₹1,100 with volume confirmation, ensuring bullish candlestick patterns emerge.
🎯 Targets:
Target 1: ₹1,150
Target 2: ₹1,200
Target 3: ₹1,250
Stop Losses:
Critical Stop: ₹1,050 (supply zone breakout level)
If the supply zone sustains and market fails to hold above these levels, no more expectations on this stock.
💰 Q1 FY26 Financial Highlights (vs Q4 FY25 & Q1 FY25)
Total Income: ₹12,294 Cr (↓ -6.7% QoQ from ₹13,183 Cr; ↓ -9.7% YoY from ₹13,618 Cr)
Total Expenses: ₹9,289 Cr (↓ -14.9% QoQ from ₹10,922 Cr; ↓ -13.8% YoY from ₹10,779 Cr)
Operating Profit: ₹3,006 Cr (↑ +32.9% QoQ from ₹2,262 Cr; ↑ +5.9% YoY from ₹2,839 Cr)
Profit Before Tax: ₹2,018 Cr (↑ +2,703% QoQ from ₹72 Cr; ↑ +8.6% YoY from ₹1,859 Cr)
Profit After Tax: ₹1,498 Cr (Turnaround from ₹-304 Cr QoQ; ↑ +11.8% YoY from ₹1,338 Cr)
Diluted EPS: ₹14.65 (↑ +540% QoQ from ₹-3.33; ↑ +11.5% YoY from ₹13.14)
🧠 Fundamental Highlights
Jindal Steel delivered a spectacular operational turnaround in Q1 FY26 with PAT surging to ₹1,498 crore, marking an impressive 11.8% YoY growth and complete recovery from Q4 FY25 losses. The dramatic quarterly improvement showcases superior cost management with expenses declining 14.9% while operating profits jumped 32.9%.
Market cap stands at ₹1,05,635 crore (up 7.49% in 1 year) with strong promoter holding of 62.4% indicating management confidence. The company maintains diversified operations across steel, power, mining and infrastructure sectors providing business stability.
Operating margin expansion from 20.8% in Q1 FY25 to 24.5% in Q1 FY26 demonstrates exceptional operational efficiency improvements. The integrated steel-to-power business model offers competitive advantages and revenue diversification benefits.
India's steel sector momentum provides strong tailwinds with market projected to grow from $102.67 billion in 2024 to $166.96 billion by 2030 at 8.28% CAGR. Infrastructure boom and government initiatives support sustained steel demand growth prospects.
Cost optimization excellence reflected in 13.8% YoY expense reduction while maintaining operational capabilities, showcasing management's focus on profitability enhancement. The company's strategic positioning in key infrastructure segments aligns with India's growth trajectory.
EPS improvement from negative territory to ₹14.65 validates the operational turnaround strategy. Strong balance sheet fundamentals and debt management support the technical breakout thesis for sustained momentum.
✅ Conclusion
Jindal Steel's remarkable Q1 FY26 turnaround with 11.8% YoY PAT growth and operational margin expansion creates compelling technical setup at the 1050-1100 resistance zone. The company's integrated business model and sector tailwinds from India's infrastructure boom provide strong fundamental backing. Critical breakout above ₹1,100 with volume confirmation could unlock significant upside to the ₹1,250 target zone. Support at ₹1,050 breakout level must sustain for continued bullish trajectory.
Jindal Steel Breakout Study | Momentum, Volume & Key Levels📊 STWP Stock Analysis – JINDAL STEEL (3rd Sept 2025)
Price Action:
Jindal Steel surged to a CMP of ₹1028.35, marking an impressive +5.46% gain on the day. The stock is currently riding on strong momentum with a clear bullish crossover trend, signaling further upside potential. However, traders must remain cautious as the risk level is high, fueled by sharp price swings. What adds conviction to the move is the heavy volume participation, showing strong market interest and active participation by investors.
Volume & Participation
Jindal Steel witnessed a massive trading volume of 45.2 lakh shares today, almost 2x its 20-SMA average of 19.9 lakh shares (Volx: 1.98x ). This sharp surge in participation clearly highlights the presence of strong hands in action, adding weight to the bullish move and reinforcing market conviction.
Indicator Check
The indicators are painting a mixed yet insightful picture for Jindal Steel. The RSI at 61.1 shows strong momentum, while the CCI at 109 confirms a bullish bias. However, the MACD at -1.07 signals a slight bearish crossover, which needs monitoring. Meanwhile, the Stochastic at 98 suggests the stock is overbought, hinting at possible short-term profit booking. Importantly, prices remain above all key EMAs, reinforcing the broader bullish structure.
Key levels
Resistance: 1048/1067/1105
Support: 991/953/934
📰 Latest News Snapshot — JINDALSTEL
Jindal Steel & Power is making headlines on multiple fronts. In its Q1 FY26 results (Aug 12, 2025), the company delivered a strong turnaround with net profit at ₹1,494 crore, aided by a 32% QoQ jump in EBITDA and healthier margins at 24.4%, though revenues softened to about ₹12,294 crore. On the operational side, JSPL commissioned its first continuous galvanising line (CGL-1) at Angul, Odisha, enhancing its ability to supply value-added coated steel for automobiles, appliances, infrastructure, and construction — a big step in product diversification. Meanwhile, the market responded positively as the stock surged 4–5% on heavy volumes on September 3, 2025, also factoring in its recent ₹2/share final dividend declaration.
🧭 Sentiment Outlook & Investment Perspective
Jindal Steel & Power is showing a moderately positive outlook, backed by a strong turnaround in profitability with margins and EBITDA improving, while its new galvanising line at Angul adds valuable capacity in coated steel for autos, appliances, and infrastructure — a move that strengthens its long-term product mix and earnings potential. The recent surge in trading volumes and price action highlights strong market participation, which can attract further momentum buying in the near term. However, risks remain in the form of softer revenues, exposure to the cyclical swings of steel prices and exports, and the possibility of short-term corrections after sharp rallies. In the short term, volatility may stay elevated as the stock digests its recent gains, but in the long term, the focus on higher-margin products and disciplined capacity expansion positions the company constructively for sustainable growth — making it a stock to watch with cautious optimism.
🚀 Bullish Momentum
The stock is also riding on strong technical momentum, with a Bullish Marubozu candle and an Open = Low setup, both pointing to firm buying support. A Bollinger Band breakout following a BB squeeze indicates the potential for sharp price expansion. Adding to the momentum, an RSI breakout, combined with a powerful bullish candle structure, confirms the strength of the move. The setup even aligns with a possible Buy Today, Sell Tomorrow (BTST) opportunity, making the near-term trend look decisively bullish.
📊 STWP Trade Analysis – JINDAL STEEL
JINDAL STEEL is showing strong momentum supported by volume. I will consider my entry near ₹1030 as part of a breakout setup. If the stock dips closer to ₹1015, I will look at that as a more conservative entry with tighter risk, which suits my swing trading approach.
For me, the pullback level around ₹954.25 is an important support zone where buyers might re-enter, while the invalidation level near ₹910 would signal that my bullish view has failed. On the upside, I will be watching ₹1117 and ₹1205 as possible target zones if momentum continues. 🚀
⚠️ Disclaimer – Please Read Carefully
The information shared here is meant purely for learning and awareness. It is not a buy or sell recommendation and should not be taken as investment advice. I am not a SEBI-registered investment advisor, and all views expressed are based on personal study, chart patterns, and publicly available market data.
Trading — whether in stocks or options — carries risk. Markets can move unexpectedly, and losses can sometimes exceed the money you have invested. Past performance or past setups do not guarantee future results.
If you are a beginner, treat this as a guide to understand how the market works — practice on paper trades before risking real money. If you are experienced, always assess your own risk, position sizing, and strategy suitability before entering trades.
Consult a SEBI-registered financial advisor before making any real trading decision. By engaging with this content, you acknowledge full responsibility for your trades and investments.
💬 Found this useful?
🔼 Give this post a Boost to help more traders discover clean, structured learning.
✍️ Drop your thoughts, questions, or setups in the comments — let’s grow together!
🔁 Share with fellow traders and beginners to spread awareness.
👉 “If you liked this breakdown, follow for more clean, structured setups with discipline at the core.”
🚀 Stay Calm. Stay Clean. Trade With Patience.
Trade Smart | Learn Zones | Be Self-Reliant 📊

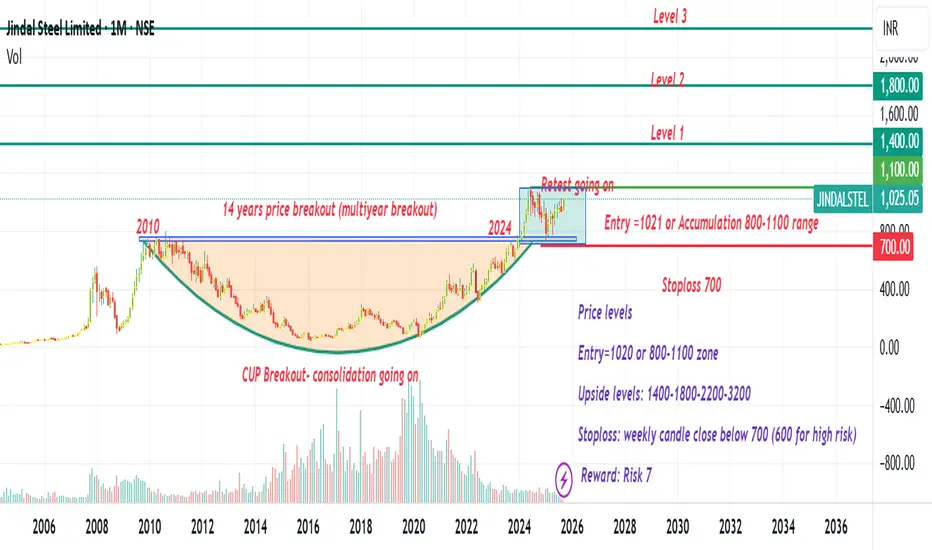
Jindal Steel multiyear price breakout #Nifty #JINDALSTELPrice is breaking out after 14 years, showing a multi-year price breakout.
Maybe a a Good chance for a Multi-bagger return
Entry: Current price or 800-1100 range
Stoploss: monthly or weekly close below 700
Upside levels: 1100-1400-1800-2200-3200
Analysis just for a learning point of view
Not a recommendation
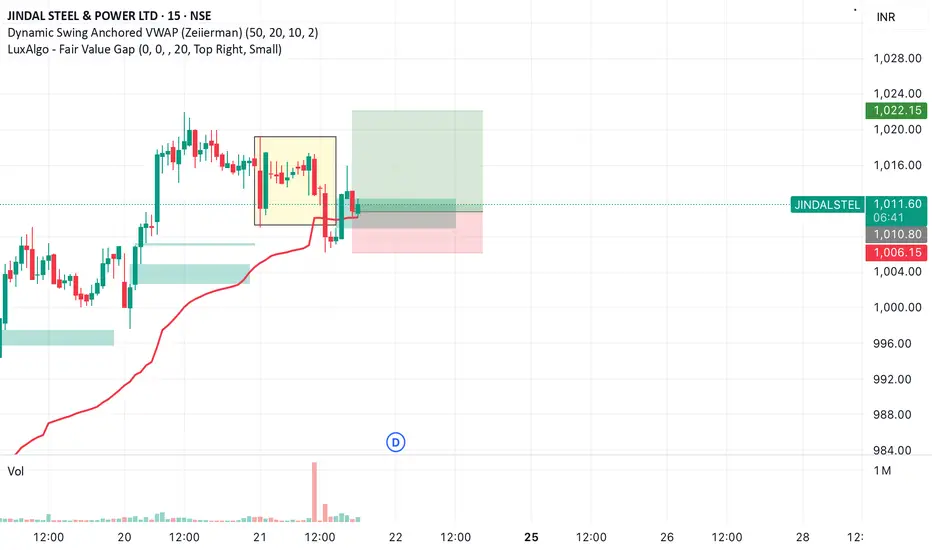
Steel set to show strength Jindal Steel is showing strength after retesting its anchored VWAP (red line) and filling the Fair Value Gap (FVG). The price respected this support zone, suggesting strong demand absorption at lower levels. With buyers stepping in near VWAP, the setup favors a bounce toward higher levels.
• Entry Zone: ₹1,010–1,012 (near VWAP + FVG support)
• Stop Loss: ₹1,006 (below recent support / invalidation)
• Target 1: ₹1,022
• Target 2: ₹1,024+
R:R: ~1:3 (favorable)
As long as price holds above VWAP, bias stays bullish. A break above ₹1,013 can accelerate momentum toward the targets.
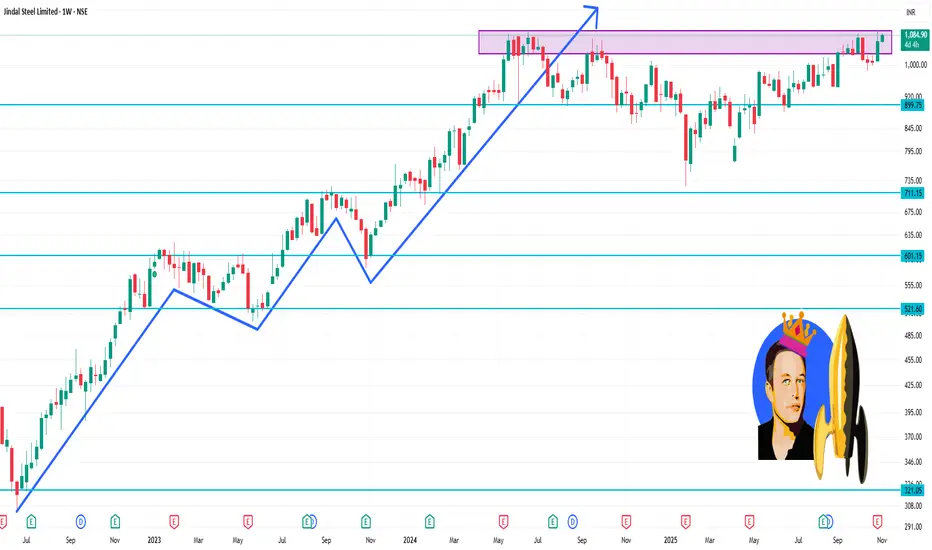
Jindal Steel & Power – Setting the Stage for a Bullish Breakout!Jindal Steel & Power Ltd (JSPL) has been quietly building strength, and I believe it’s getting ready for a significant bullish move. Backed by a strong order book, aggressive capacity expansion, and rising demand in the infrastructure and energy sectors, this steel giant is poised to benefit from India’s ongoing industrial momentum.
🔍 Why Jindal Steel Looks Bullish:
Strong Fundamentals: JSPL has shown consistent revenue and EBITDA growth, with a healthy debt reduction strategy over the past few years.
Sector Tailwinds: With government focus on infrastructure and renewable energy, the demand for structural steel and power is set to rise.
Technical Setup: The stock has been forming higher highs and higher lows—a classic uptrend. The current consolidation around ₹980 looks healthy and might just be the launchpad for the next leg up.
Expansion Plans: Ongoing capacity expansions in both steel and power divisions strengthen long-term visibility.
📌 Personal View:
I personally believe that Jindal Steel is gearing up for a strong upside, and I’m very bullish on the stock from these levels. However, discipline is key—always maintain a strict stop loss (no trade should risk more than 5% of your capital).
⚠️ Disclaimer:
This is not a buy/sell recommendation, but purely a personal idea shared for educational purposes. Please do your own research and consult a financial advisor before taking any position.
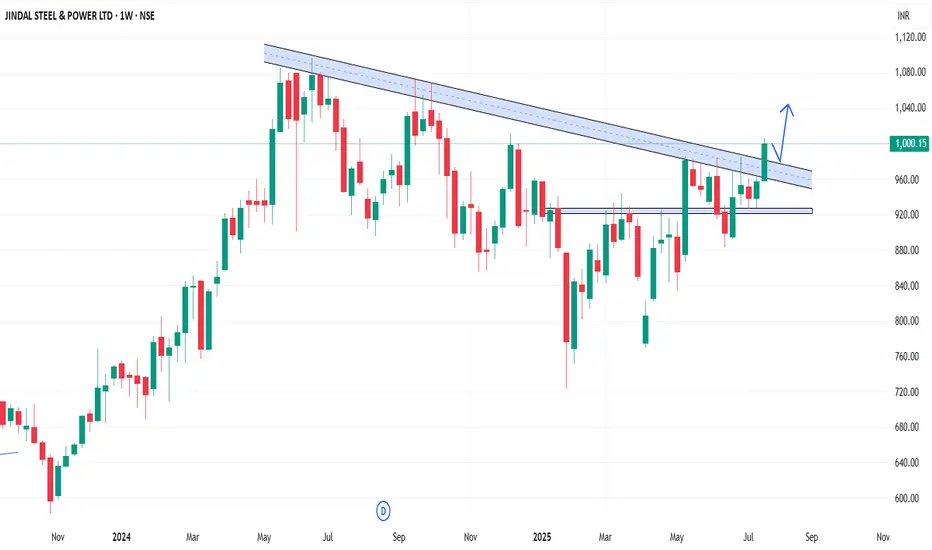
JINDALSTEL - Weekly AnalysisIn the Weekly Chart of JINDALSTEL ,
we can see that, it has given a zone breakout.
Let it retest and enter with SL and targets,
Expected momentum is shown in chart.
JINDALSTEL : pattern breakout#JINDALSTEL #patterntrading #chartpatternbreakout #swingtrading
JINDALSTEL : Swing Trading
>> Breakout soon
>> Inverse Head & Shoulder pattern
>> Good Strength & Volumes Buildup
>> Trending setup
Swing Traders can lock profits at 10% and keep Trailing
Pls boost, Comment & Follow for more Analysis
Disc : Charts shared are for Learning purpose and not a Trade recommendation. Pls consult your Financial Advisor or a SEBI Registered Advisor before taking position in it

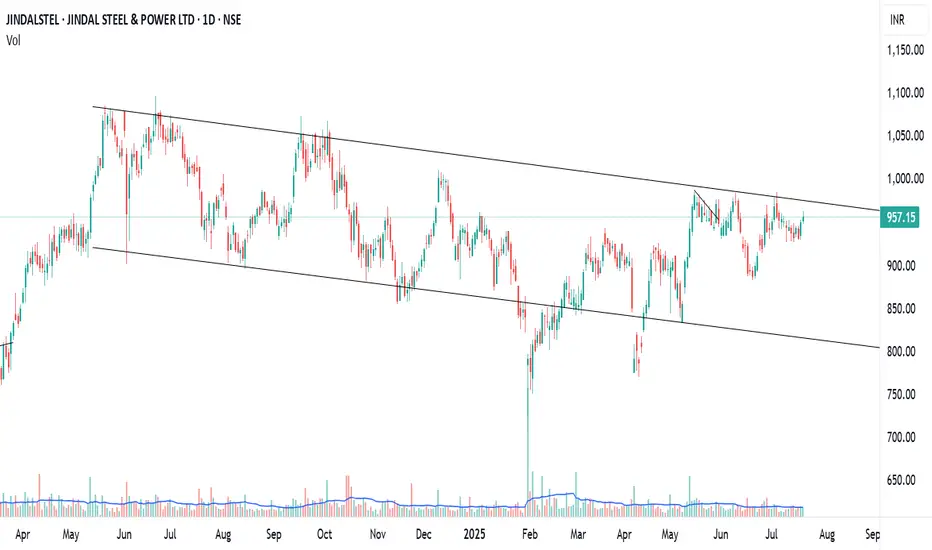
Jindhal steel on a good channel patternJindhal steel on a good channel pattern. Looks like a breakout is possible with good upside possibility.
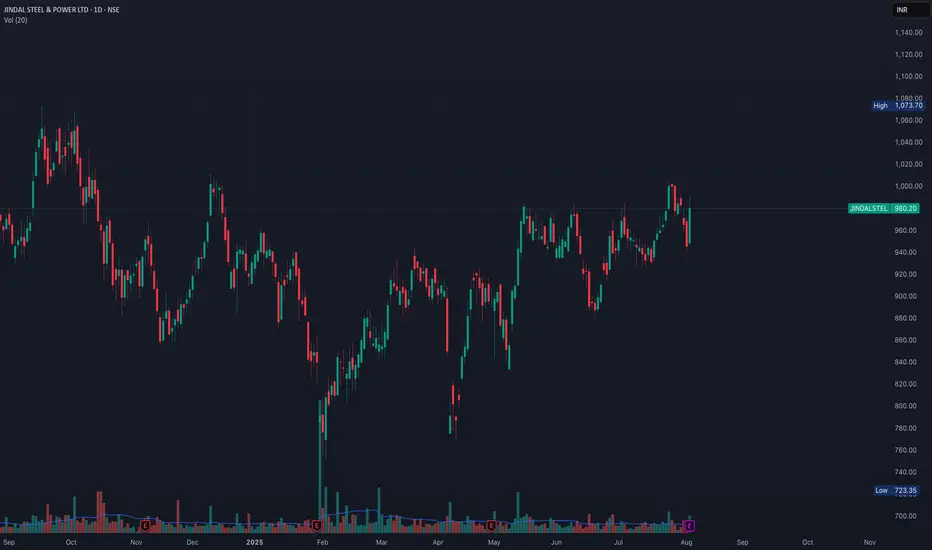
JINDALSTEL Price ActionJindal Steel & Power Limited (JINDALSTEL) is currently trading around ₹950 after a modest rebound in the last trading session. Over the past year, the stock has ranged from a high of ₹1,074 to a low of approximately ₹723, reflecting significant volatility. Much of July 2025 has seen the stock consolidating within the ₹932–₹950 zone after registering strong gains earlier in the year.
Jindal Steel & Power is among India’s leading steel producers and is active in both mining and the power sector, with operations that span internationally. The company holds a market capitalization close to ₹97,000 crore.
From a financial perspective, revenue growth has moderated, averaging about 6% compounded annually over five years, with a slight decline observed in the recent trailing twelve months. Profit growth has slowed as well, and return on equity is near 8% for the past year. The operating profit margin remains stable just under 20%, but is below the company’s multi-year peak levels. The stock trades at a price-to-earnings ratio in the higher twenties, reflecting a valuation premium that is partly attributed to its business diversification and international reach.
Recently, the resignation of CFO Mayank Gupta, effective mid-July 2025, may create some near-term uncertainty in investor sentiment. On the positive side, the promoters have increased their stake by about 1% in the recent quarter—a sign of internal confidence.
On the technical chart, ₹950 serves as both a support and resistance level. Sustained movement above this could pave the way toward retesting the 52-week highs, while a drop below this area could invite further downward consolidation to the ₹930 or lower levels.
In summary, Jindal Steel & Power continues to be fundamentally sound within the steel sector, despite softer growth figures and current price consolidation. Investors should watch for potential breakouts near current levels, keep an eye on management transitions, and monitor broader sector trends for further cues.
Same top, weaker legs
“Same top, weaker legs.”
That’s the story playing out here — a textbook double top near ₹970 with diminishing momentum and signs of buyer exhaustion.
This setup is calling for a tactical short — nothing heroic, just clean risk-reward over 2–3 days.
⸻
Technical Breakdown:
• Key Resistance at ₹970:
Price tested this level twice, failed both times with visible selling pressure and long upper wicks — a classic sign of supply absorption.
• Volume Divergence:
Second attempt to break above ₹970 came with lower volume, suggesting a lack of aggressive buyers at the top.
• Rising into Resistance:
The current rally into resistance looks like a liquidity grab — ideal for a fade short trade.
• Failure to Hold Above Resistance:
Despite multiple attempts, the stock is unable to sustain above ₹970 — a good spot for a mean reversion short.
⸻
Sell Call (Intraday to 2–3 Days Swing)
• Sell Zone: ₹969–₹972
• Stop Loss: ₹977 (above wick highs)
• Target 1: ₹950
• Target 2: ₹930
• Max Duration: 2–3 sessions
• Risk-Reward: ~1:3 if held till ₹930
⸻
Key Trigger to Watch:
If price fails to hold above ₹967 intraday, expect a fast slide. A break below this area should increase downside momentum.
⸻
Why This Works:
This is a classic case of distribution at the top, with buyers trapped just below resistance. In a market with even slight weakness, this can unwind fast.
“Let the breakout fail — then short the failure.”
That’s the setup here.

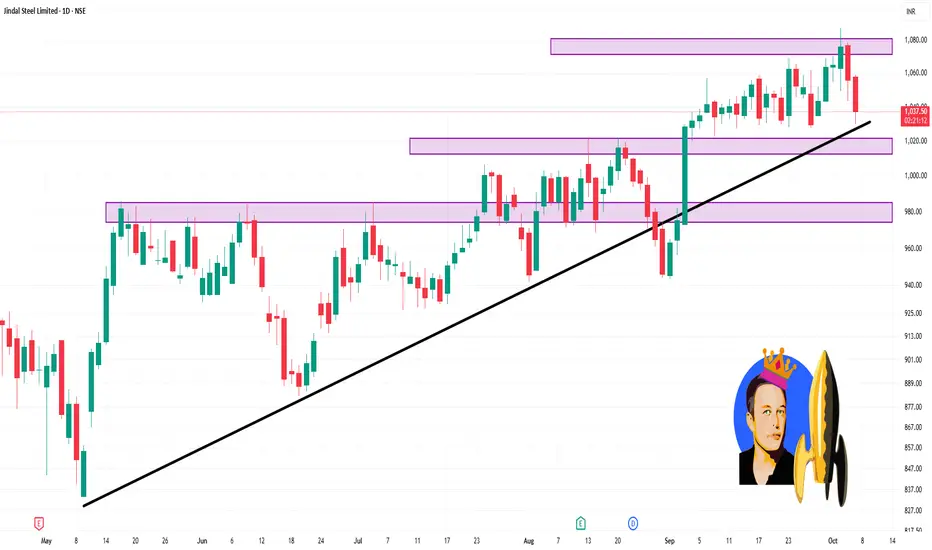
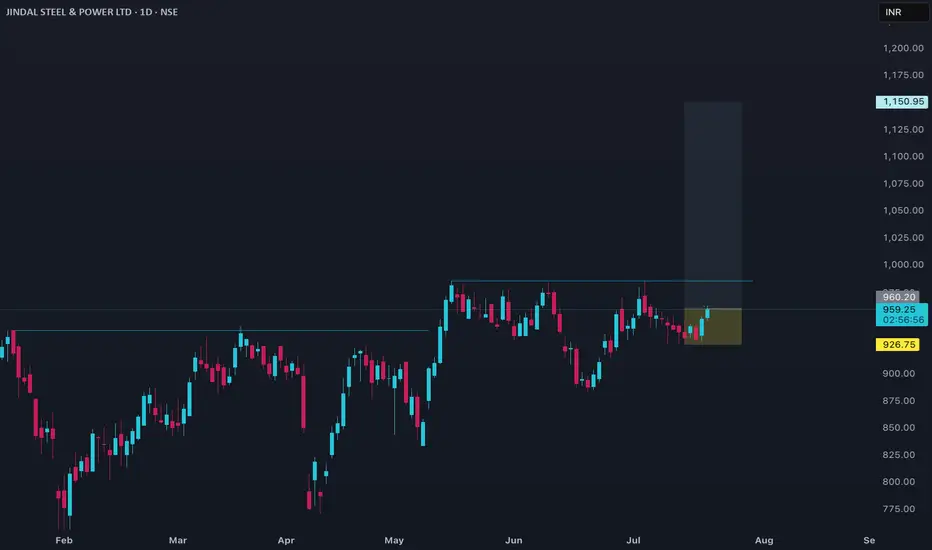
Jindal Steel & Power Ltd_Will it move above ???Chart Pattern & Price Action
The stock has been trading sideways within a rectangle range between approximately ₹940 and ₹980 for several weeks (highlighted in the blue box).
Today's price action shows a strong bullish candle breaking toward the upper edge of the consolidation zone, closing at ₹979.00, very close to resistance.
⚠️ Key Levels
Resistance (Breakout Zone): ~₹980
Support (Range Bottom): ~₹940
🔍 Interpretation
If the stock closes above ₹980 with good volume, it could indicate a bullish breakout, suggesting a potential continuation of the prior uptrend.
If it fails to break ₹980 convincingly, the stock may continue to consolidate or face a short-term pullback.
📌 Conclusion
Bias: Bullish (with confirmation on breakout above ₹980)
Next Resistance (if breakout happens): ₹1,000–₹1,020 zone
Support to watch: ₹940
All the information provided is for educational and informational purposes only. No any buy or sell recommendations.

Amazing breakout on WEEKLY Timeframe - JINDALSTELCheckout an amazing breakout happened in the stock in Weekly timeframe, macroscopically seen in Daily timeframe. Having a great favor that the stock might be bullish expecting a staggering returns of minimum 25% TGT. IMPORTANT BREAKOUT LEVELS ARE ALWAYS RESPECTED!
NOTE for learners: Place the breakout levels as per the chart shared and track it yourself to get amazed!!
#No complicated chart patterns
#No big big indicators
#No Excel sheet or number magics
TRADE IDEA: WAIT FOR THE STOCK TO BREAKOUT IN WEEKLY TIMEFRAME ABOVE THIS LEVEL.
Checkout an amazing breakout happened in the stock in Weekly timeframe.
Breakouts happening in longer timeframe is way more powerful than the breakouts seen in Daily timeframe. You can blindly invest once the weekly candle closes above the breakout line and stay invested forever. Also these stocks breakouts are lifelong predictions, it means technically these breakouts happen giving more returns in the longer runs. Hence, even when the scrip makes a loss of 10% / 20% / 30% / 50%, the stock will regain and turn around. Once they again enter the same breakout level, they will flyyyyyyyyyyyy like a ROCKET if held in the portfolio in the longer run.
Time makes money, GREEDY & EGO will not make money.
Also, magically these breakouts tend to prove that the companies turn around and fundamentally becoming strong. Also the magic happens when more diversification is done in various sectors under various scripts with equal money invested in each N500 scripts.
The real deal is when to purchase and where to purchase the stock. That is where Breakout study comes into play.
Check this stock which has made an all time low and high chances that it makes a "V" shaped recovery.
> Taking support at last years support or breakout level
> High chances that it reverses from this point.
> Volume dried up badly in last few months / days.
> Very high suspicion based analysis and not based on chart patterns / candle patterns deeply.
> VALUABLE STOCK AVAILABLE AT A DISCOUNTED PRICE
> OPPURTUNITY TO ACCUMULATE ADEQUATE QUANTITY
> MARKET AFTER A CORRECTION / PANIC FALL TO MAKE GOOD INVESTMENT
DISCLAIMER : This is just for educational purpose. This type of analysis is equivalent to catching a falling knife. If you are a warrior, you throw all the knives back else you will be sorrow if it hits SL. Make sure to do your analysis well. This type of analysis only suits high risks investor and whose is willing to throw all the knives above irrespective of any sectoral rotation. BE VERY CAUTIOUS AS IT IS EXTREME BOTTOM FISHING.
HOWEVER, THIS IS HOW MULTIBAGGERS ARE CAUGHT !
STOCK IS AT RIGHT PE / RIGHT EVALUATION / MORE ROAD TO GROW / CORRECTED IV / EXCELLENT BOOKS / USING MARKET CRASH AS AN OPPURTUNITY / EPS AT SKY.
LET'S PUMP IN SOME MONEY AND REVOLUTIONIZE THE NATION'S ECONOMY!