JINDAL STEEL AND POWER FORGING AHEADWith the overall metal sector giving a breakout on the charts, a few stocks are lagging behind and a few are fueling the rally and one among them is JINDAL STEEL & POWER ,the stock had earlier rallied with the metal sector and after a wide range low volume consolidation of about 10 months the stock has given a breakout ,it is not suggested to immediately jump into the stock ,instead wait for a potential retest/pullback around 475/500 levels as the RSI has entered the overbought zone . the medium to long term targets could be 550/600/700
JINDALSTEL trade ideas

Vora Trades: #4 JINDALSTEL: BreakoutI have already entered the trade a while ago but forgot to add it here. There are some nuances in this trade that my followers would know. If you see 3 green candles in a row, wait for a pullback. I have added the link to the TradingView article which explains this concept in thorough detail, please refer to the same and all questions are welcome. My entry is premature because of my experience in the market and I could sense this move. This is not advisable. Please do not copy my trades, for I am not responsible for the losses incurred. This is strictly educational material.

Jindal Steel & power Long idea It forms continue falling wedge pattern .It can long for target 600 and 650 soon add more if come down to 504

Jindal steelCan go long, range break out + secotor look super strong , can easily achieve the given target in short term.

Jindal Steel Ready for BreakoutNSE:JINDALSTEL
Jindal Steel is Ready for Breakout but you should only consider this if the resistance level breaks with High Volume .


Analysis | Momentum Candle | Triangle Breakout | EMA | Volume | Positive Momentum in stock, price given a triangle breakout and currently at resistance level.
In past three past session, hammer followed by indecisive candle and momentum candle created with rise in volume.
Entry will be resistance breakout in daily chart, stop loss mentioned in chart and target as per price actions.
Note : The price is above all key moving average.
Thanks

#StockMarket #StockIdeas #StocktoWatch #StockToBuy #positionalJINDAL STEEL & POWER
Chart in uptrend and broke important resistance level of 350
Stock after breakout consolidating in a range & bounced from 61% fib level
Also Flag pattern formation on chart
if sustains above 500 then we can buy for short term trade with sl below 450 DCB
target 600, 750
For stoploss in Intraday use 5 minute chart and see nearest support.
for target use 5 min chart and fibonacci pivots as i don't keep predefined target.
try to book partially and trail.
NOTE:
In case of Gapup or Gap down then avoid setup
Do your own analysis before taking trade
Above levels are for education purpose only

Flag and Pole breakout in Jindal SteelCHART -> JINDALSTEEL WEEKLY SETUP
As seen per the chart, Flag and Pole breakout in Jindal Steel.
First hurdle is to cross all time high of 501, so that will be our first target. Next target should be around 750. Since it is a weekly chart time period is 3 months to 1 year. Stoploss should be at 375 on weekly closing basis.
Disclaimer: This is for educational purpose only. This is not any recommendations. I am not SEBI registered. Please consult your financial advisor before taking any action.

Jindal Steel.... There is a chance........Keep an Eye on it..It can be a good trade because Stoploss is very less. Risk Reward Ratio will be good.

Breakout in Jindal Steel & Power Limited...Chart is self explanatory. Entry, Targets and Stop Loss are mentioned on the chart.
Disclaimer: This is for demonstration and educational purpose only. This is not buying or selling recommendations. I am not SEBI registered. Please consult your financial advisor before taking any trade.

#JINDALSTEL - Potential Breakout idea#JINDALSTEL - Potential Breakout idea
CMP - 479
Only Above 505
Next Levels can be expected 550 & 650
View will be negated below 364
Disclaimer : We are not Sebi registered analyst or Authorized analyst
The charts / Levels / Price projections are only for educational purpose.
This is our personal view, Pls consult your financial advisor before taking decision - Buy / Sell
We will be not responsible for your profit and Loss
Please like and retweet if you like this idea.


Jindal Steel BullishJindal steel seems strong weekly closing indicates rally may continue further
concentrate if price sustain above 480 in daily

Broken out past one year “down sloping” The stock has observed shift of trend as it has decisively broken out past one year “down sloping” channel at 450 levels
This buying momentum was observed from its 20, 50, 100 and 200 day SMA which reconfirms bullish sentiments
The daily and weekly “band bollinger” Jindal Steel & Power Limited buy signals increased momentum to the upside
Rising volumes on this rally signals increased participation at lower levels
The daily strength indicator RSI is in bullish mode along with positive crossover which supports rising strength in near term.
The above analysis indicate an upside of 510-525 levels

Jindal Steel and Power Wyckoff consolidationJindal is coming out of consolidation which started end of April 2021.. Enter at 450 - 470 for target of 650 - 680

flag pattern in making with multiple confluencebroken important resistance around 350 and than consolidating in a range .
bounced from 0.61% retracement level of fibonacci.
flag kind of structure is in progress.
buy above 500 in intraday
if sustains above 500 than we can buy for short term trade with sl below 450 DCB
target 600, 750
For stoploss in Intraday use 5 minute chart and see nearest support.
for target use 5 min chart and fibonacci pivots as i don't keep predefined target.
try to book partially and trail.
Note: this is not a prediction for LONG/SHORT, trade will trigger only on given level as per technical analysis
NOTE: For Gapup or bo before 9:20
If gapup is more than 1% from bo level than avoid completely.
if less than 1% or gives bo before 9:20 than wait for
first 5 minute candle and entry above 5 minute candle
and revised SL below candle Low.

#Jindalstel cash : Looks good above 450.10#Jindalstel cash -Short term
08 March 2022
Looks good above 450.10
and dips 444
stoplosss 435
Target 464/474
Cmp 442

[Buddha] JINDALSTEL inside Bar ideaLong if it breaks the high of the previous day with a stop loss at the previous day's low.
Short if it breaks the low of the previous day with a stop loss at the previous day's high.
In case of gap up above the previous day's high or gap down below the previous day's low, please avoid buying it or selling it respectively. Follow the ending of the candle formed in first 5 minutes and follow ORB strategy.

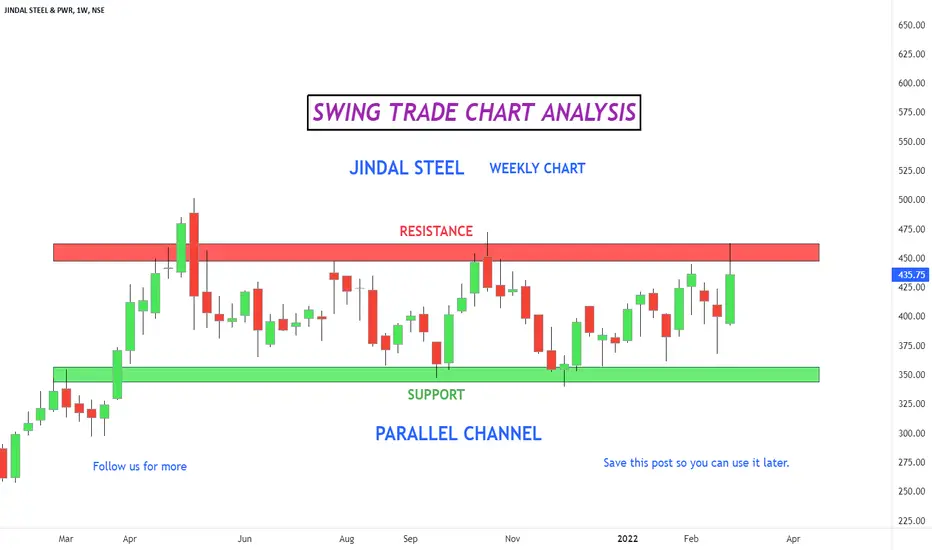
Jindal Steel : Parallel channel (Time frame - 1 Week )Chart of - Jindal Steel
Stock is trading in a range by forming a parallel channel .
You can enter in this stock after proper breakout.
Leave us a comment or like to keep our content for free and alive.
Have a great day everyone!
Disclaimer: All charts are purely for educational and information purpose only. I am not a SEBI registered Investment advisor. Please Trade and invest based on your knowledge and risk profile.
Jindal Steelhigh : 10/05/2021 : 501.70
low : 03/04/2020 : 62.00
75 % : 391.77
50% : 281.85
25% : 171.92

Jindal Steel trying to maintainThe sudden rise in commodities is helping the Steel industry, and the same can be seen in Jindal Steel.
Jindal Steel gave a Golden Cross pattern where 50 DMA crossed 200 DMA 3 sessions back, and we saw a sudden jump in the stock.
The stock took the resistance of 463 and retreated in yesterday's session. Today the stock opened in green and took resistance of 452 and currently can be seen as in consolidating stage.
Resistance levels based on GANN Square of 9 are 452, 463 and 474 and based on Fibonacci is 473.
Support levels based on GANN Square are 441 and 431, and based on Fibonacci are 444, 428 and 420.

Possibility of a breakout in JINDAL STEEL and POWERPossibility of Breakout in JINDAL STEEL AND POWER . Please keep this stock in your watchlist. One can enter above 450.
DISCLAIMER: The ideas are only for educational purposes and not buy/sell recommendation. I am NOT SEBI registered.
