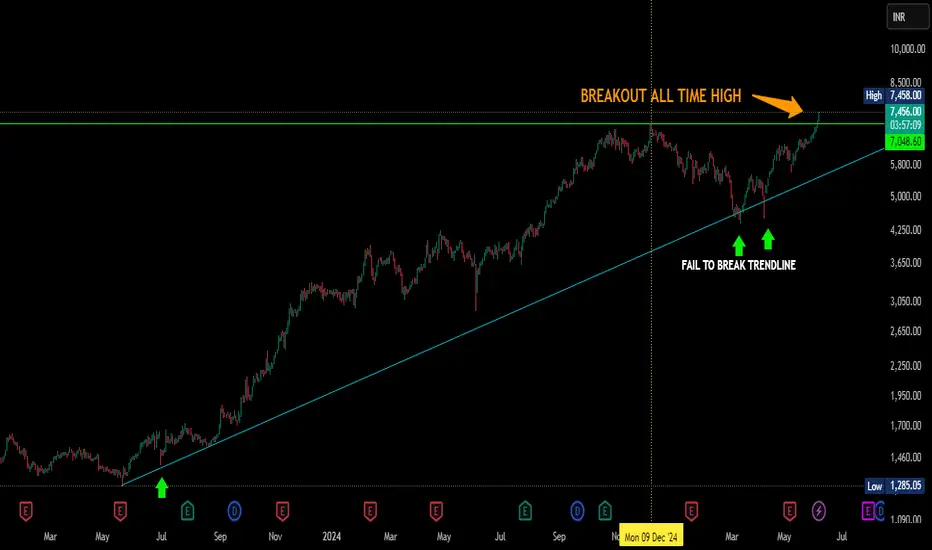
The Evening Doji StarMCX CMP 8048
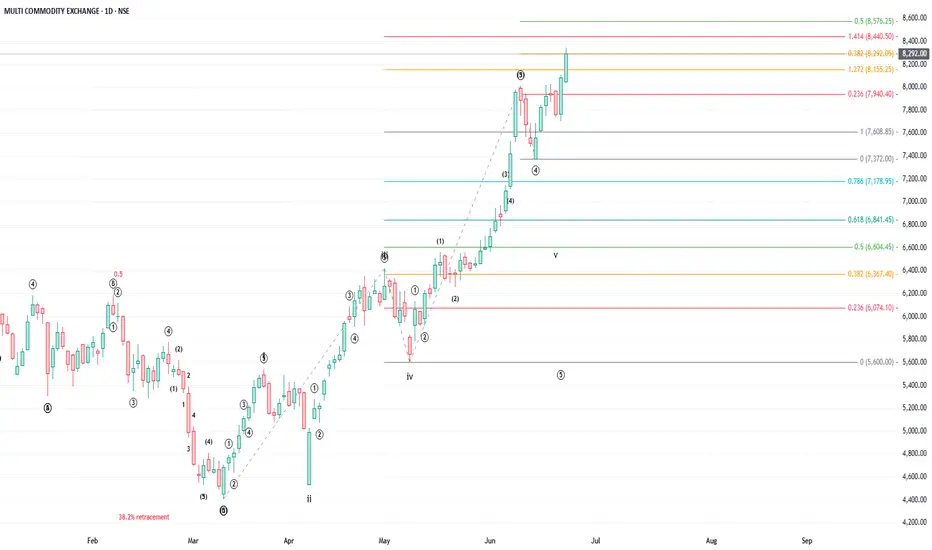
Elliott - the v the wave of this swing is bigger than the third wave. This is the indication of a dramatic fall.
Candlestick pattern - the Evening Doji Star is a reversal pattern. Since this pattern is on the weekly charts the intermediate trend is down.
Fibs - The v th wave has
MULTI COMMODITY EXCHANGE OF IN
7,661.35INRD
−33.45−0.43%
As of today at 07:33 GMT
INR
No trades
Next report date
≈
Today
Report period
Q1 2025
EPS estimate
38.72 INR
Revenue estimate
3.87 B INR
109.95 INR
5.60 B INR
12.09 B INR
43.34 M
About MULTI COMMODITY EXCHANGE
Sector
Industry
CEO
Praveena Rai
Website
Headquarters
Mumbai
Founded
2002
ISIN
INE745G01035
FIGI
BBG001M0Q548
Multi Commodity Exchange of India Ltd. engages in the facilitation of online trading, clearing, and settlement operations of commodity derivatives. It also offers trading in commodity derivative contracts across varied product segments including bullion, base metals, energy, and agricultural basket commodities. The company was founded on April 19, 2002 and is headquartered in Mumbai, India.
40.0%
42.5%
45.0%
47.5%
50.0%
Q4 '23
Q1 '24
Q2 '24
Q3 '24
Q4 '24
0.00
900.00 M
1.80 B
2.70 B
3.60 B
Revenue
Net income
Net margin %
Revenue
Op expenses
Op income
Int expenses
Non-op income/expenses
Pretax income
Taxes & Other
Net income
−1.10 B
0.00
1.10 B
2.20 B
3.30 B
Revenue
Op expenses
Op income
Expenses & adjustments
Net income
0.00
900.00 M
1.80 B
2.70 B
3.60 B
No news here
Looks like there's nothing to report right now

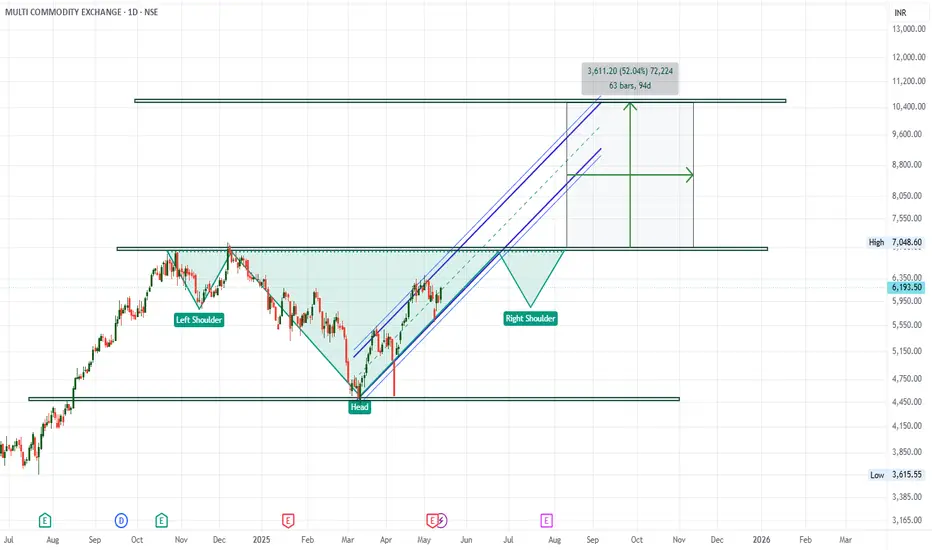
MCX getting Ready for Big 50% upmove in coming 10-12 Months.MCX getting Ready for Big 50% upmove in coming 10-12 Months.
On Daily charts we can see the Previous high of 6900 can be broken in 1-2 Months.
Post Consolidation around 6900 we can see MCX may complete H&S Pattern & Breakout above 7000 can push the stock towards 10000+ Zone.
LTP - 6190
Short Ter
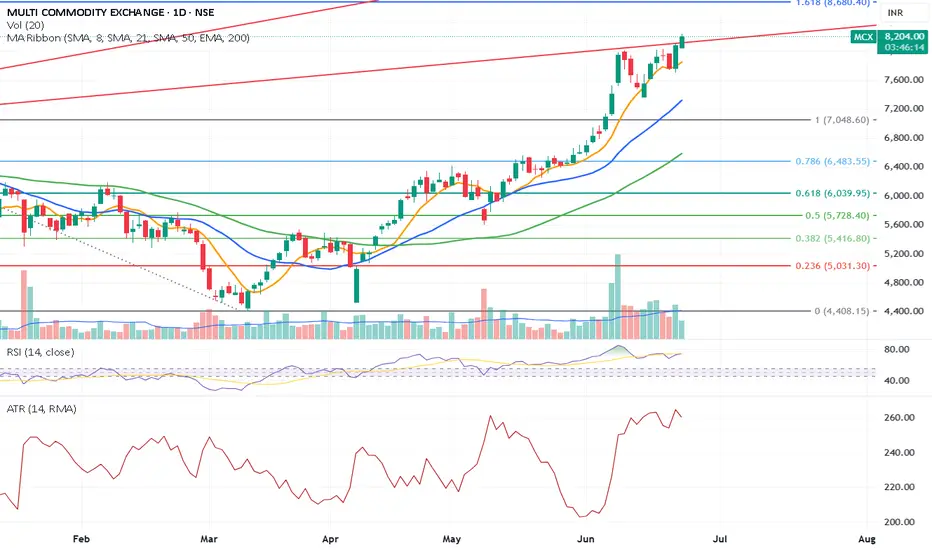

MCX - Bullish Breakout Opportunity (Daily Timeframe)Stock: MCX ( NSE:MCX )
Trend: Bullish Momentum Building 🚀
Risk-Reward Ratio: 1:3 (Favorable Setup)
Trade Parameters
🎯 Entry Zone: ₹6,200 (Breakout Confirmation)
🛑 Stop Loss: ₹5,531 (Daily Closing Basis) (~10.8% Risk)
🎯 Target Levels:
₹6,515.65
₹6,852.60
₹7,160.00
₹7,479.80
₹7,854.20
₹8,200 (Fin
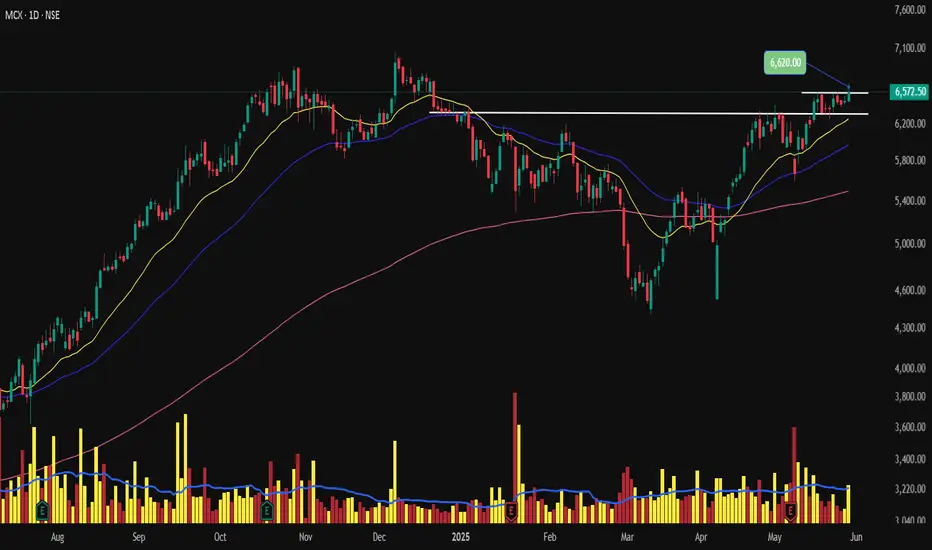
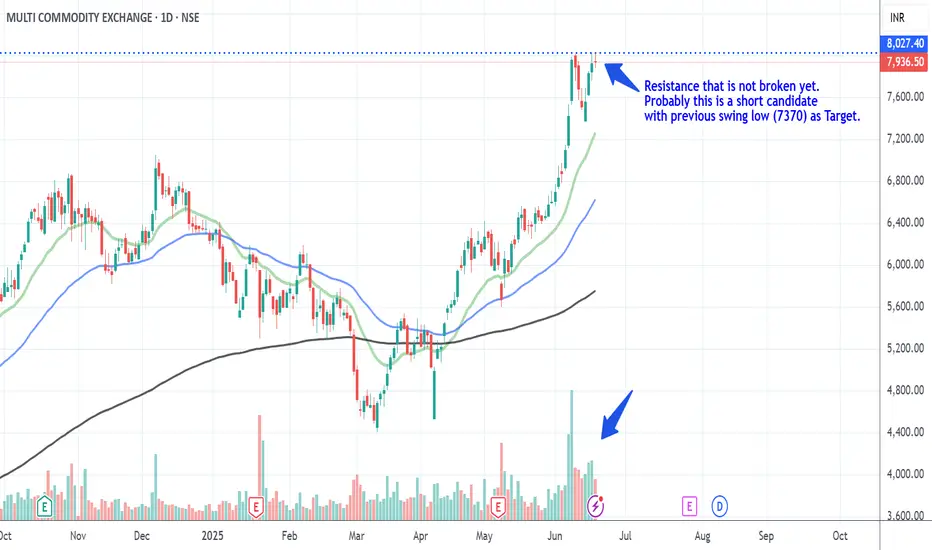
MCX back on trackChart -> MCX Daily
Come back breakout!
CMP: 5581
Good Range to Buy: 5350 to 5550
Targets: 6100, 6440, 6870
SL: 5260 Daily Close
Disclaimer: This is for educational purposes only, not any recommendations to buy or sell. As I am not SEBI registered, please consult your financial advisor before taki

See all ideas
Summarizing what the indicators are suggesting.
Neutral
SellBuy
Strong sellStrong buy
Strong sellSellNeutralBuyStrong buy
Neutral
SellBuy
Strong sellStrong buy
Strong sellSellNeutralBuyStrong buy
Neutral
SellBuy
Strong sellStrong buy
Strong sellSellNeutralBuyStrong buy
An aggregate view of professional's ratings.
Neutral
SellBuy
Strong sellStrong buy
Strong sellSellNeutralBuyStrong buy
Neutral
SellBuy
Strong sellStrong buy
Strong sellSellNeutralBuyStrong buy
Neutral
SellBuy
Strong sellStrong buy
Strong sellSellNeutralBuyStrong buy
Displays a symbol's price movements over previous years to identify recurring trends.
Frequently Asked Questions
The current price of MCX is 7,661.35 INR — it has decreased by −0.43% in the past 24 hours. Watch MULTI COMMODITY EXCHANGE OF IN stock price performance more closely on the chart.
Depending on the exchange, the stock ticker may vary. For instance, on BSE exchange MULTI COMMODITY EXCHANGE OF IN stocks are traded under the ticker MCX.
MCX stock has fallen by −6.84% compared to the previous week, the month change is a −14.53% fall, over the last year MULTI COMMODITY EXCHANGE OF IN has showed a 76.28% increase.
We've gathered analysts' opinions on MULTI COMMODITY EXCHANGE OF IN future price: according to them, MCX price has a max estimate of 10,000.00 INR and a min estimate of 5,750.00 INR. Watch MCX chart and read a more detailed MULTI COMMODITY EXCHANGE OF IN stock forecast: see what analysts think of MULTI COMMODITY EXCHANGE OF IN and suggest that you do with its stocks.
MCX stock is 2.44% volatile and has beta coefficient of 1.76. Track MULTI COMMODITY EXCHANGE OF IN stock price on the chart and check out the list of the most volatile stocks — is MULTI COMMODITY EXCHANGE OF IN there?
Today MULTI COMMODITY EXCHANGE OF IN has the market capitalization of 392.42 B, it has increased by 0.61% over the last week.
Yes, you can track MULTI COMMODITY EXCHANGE OF IN financials in yearly and quarterly reports right on TradingView.
MULTI COMMODITY EXCHANGE OF IN is going to release the next earnings report on Aug 1, 2025. Keep track of upcoming events with our Earnings Calendar.
MCX earnings for the last quarter are 26.80 INR per share, whereas the estimation was 31.10 INR resulting in a −13.83% surprise. The estimated earnings for the next quarter are 38.72 INR per share. See more details about MULTI COMMODITY EXCHANGE OF IN earnings.
MULTI COMMODITY EXCHANGE OF IN revenue for the last quarter amounts to 2.91 B INR, despite the estimated figure of 2.94 B INR. In the next quarter, revenue is expected to reach 3.87 B INR.
MCX net income for the last quarter is 1.35 B INR, while the quarter before that showed 1.60 B INR of net income which accounts for −15.36% change. Track more MULTI COMMODITY EXCHANGE OF IN financial stats to get the full picture.
Yes, MCX dividends are paid annually. The last dividend per share was 7.64 INR. As of today, Dividend Yield (TTM)% is 0.10%. Tracking MULTI COMMODITY EXCHANGE OF IN dividends might help you take more informed decisions.
MULTI COMMODITY EXCHANGE OF IN dividend yield was 0.56% in 2024, and payout ratio reached 27.32%. The year before the numbers were 0.23% and 46.88% correspondingly. See high-dividend stocks and find more opportunities for your portfolio.
EBITDA measures a company's operating performance, its growth signifies an improvement in the efficiency of a company. MULTI COMMODITY EXCHANGE OF IN EBITDA is 8.28 B INR, and current EBITDA margin is 68.53%. See more stats in MULTI COMMODITY EXCHANGE OF IN financial statements.
Like other stocks, MCX shares are traded on stock exchanges, e.g. Nasdaq, Nyse, Euronext, and the easiest way to buy them is through an online stock broker. To do this, you need to open an account and follow a broker's procedures, then start trading. You can trade MULTI COMMODITY EXCHANGE OF IN stock right from TradingView charts — choose your broker and connect to your account.
Investing in stocks requires a comprehensive research: you should carefully study all the available data, e.g. company's financials, related news, and its technical analysis. So MULTI COMMODITY EXCHANGE OF IN technincal analysis shows the sell today, and its 1 week rating is buy. Since market conditions are prone to changes, it's worth looking a bit further into the future — according to the 1 month rating MULTI COMMODITY EXCHANGE OF IN stock shows the buy signal. See more of MULTI COMMODITY EXCHANGE OF IN technicals for a more comprehensive analysis.
If you're still not sure, try looking for inspiration in our curated watchlists.
If you're still not sure, try looking for inspiration in our curated watchlists.