mgl - buyBuy near 1051
easy tg - 1068
sl close below - 1043
Disclaimer : This is my personal analysis for study purpose not intended for trading.
MGL trade ideas


Swing Trade Hold in 3-4 DaysTrend line Breakout in MAHANAGAR GAS
Book profits within the first 30 minutes of the market opening
- Try to exit by taking 9-10% profit of each trade
- SL can be taken when the 5/15 min candle closes below 44EMA
Now, why do I prefer swing trades? The primary reason is that I have observed that 90% of the stocks give most of the movement in just 3-4 days and the rest of the time they either consolidate or fall
CMP- 985
Target Price 1050
Note:- I am not SEBI Registered This Trade is only educational Purpose


MGL SWING Trade Long As shown in the chart drawing study I predict my study to be right in future
Disclaimer - This is not a Stock recommendation.
Investments in securities are subject to market risk. The value and return on investment may vary because of changes in interest rates, foreign exchange rates, or any other reason.
It's an educational post for analyzing, learning & discussing general and generic information related to stocks, investments, and strategies.

BUY MGL (Diamond Pattern Breakout + Retest)Diamond pattern formation on weekly levels. Retest done successfully and breakout done too.
Looking good for strong upside movement. Minimum Target and SL updated on chart.
NOTE: Investing in this Script would require patience.

intraday, swing, short term, MGLThere is a possibility for big move
instead of intraday its better to go for 3 to 4 days of holding
with proper risk management.
.
.
.
entry: 895
stoploss: 830
.
.
refer old idea attached below

Short MGL below 1015 target 1002Short MGL below 1015 target 1002. Reason for Sell, Stock is making lower highs and lower lows and can try to fill the gap.
Please Note I am not SEBI registered advisor, this is just my view and is for educational purpose. Please consult your financial advisor before taking trade.
MGL - Mahanagar Gas Ltd looks good for move up Stock forming a classic bullish pattr and is all set for pattern continuation ,break above the trend line should trigger a good smooth move up


MGL on breakout !Mahanagar Gas Limited has broken out from its recent swing high.
Immediate target for the same is marked in the dashed line, Also if anyone wants to keep it positionally, targets are marked on the chart.
Give us a like to motivate us !

Falling wedge pattern reversal in MAHANAGAR GAS LTDMAHANAGAR GAS LTD
Key highlights: 💡⚡
📈On 1Day Time Frame Stock Showing Reversal of Falling wedge Pattern .
📈 It can give movement upto the Reversal Final target of above 1065+.
📈There have chances of breakout of Resistance level too.
📈 After breakout of Resistance level this stock can gives strong upside rally upto above 1145+.


Positional SELLScrip is breaking Daily Support which is also a Neckline.
Below Neckline we can see Breakout Failure.
This can lead momentum till next Demand Zone 920 level.
We can carry positional easily for next 2-3 Weeks.

Bullish view on MGL MGL bullish above 1030
SL 998
Target 1190+
Disclaimer - This is not a buy and sell tip,it's only for educational purpose analysis
We are not responsible for P& L

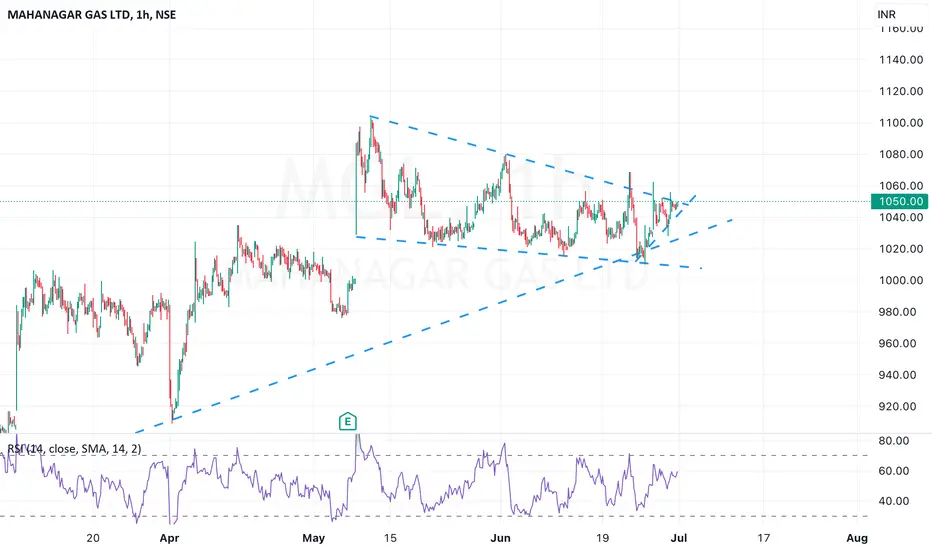
triangle breakout in MGLMGL has given symmetrical triangle breakout can consider buy 920-925 for target of 1048,1180
with stoploss of 867 for swing trade

MGLMGL:- If the stock breakouts from the trendline, it can show an upside moment. Keep an eye on the stock.
Hello traders,
As always, simple and neat charts so everyone can understand and not make it too complicated.
rest details mentioned in the chart.
will be posting more such ideas like this. Until that, like share and follow :)
check my other ideas to get to know about all the successful trades based on price action.
Thanks,
Ajay.
keep learning and keep earning.

A perfect retest in MGL on trendline- Shake off before a rallyA perfect retest in MGL on trendline. This is a kind of shake off before a rally.
Retail investors must have sold and got out till now.

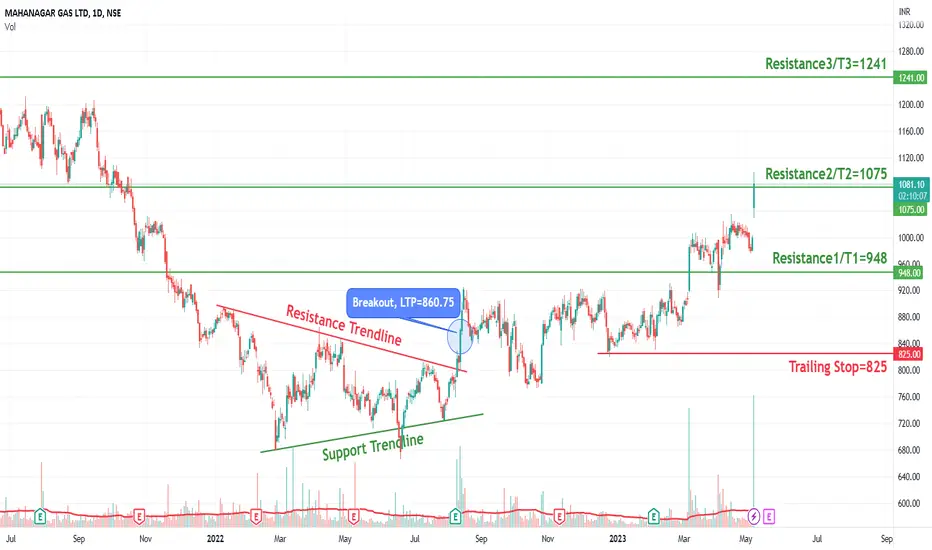
MGL - Long Setup, Move is ON..NSE:MGL
✅ #MGL trading above Resistance of 1075
✅ Next Resistance is at 1241
Related charts:
Charts are self-explanatory. Levels of breakout, possible up-moves (where stock may find resistances) and support (close below which, setup will be invalidated) are clearly defined.
Disclaimer: This is for demonstration and educational purpose only. This is not buying or selling recommendations. I am not SEBI registered. Please consult your financial advisor before taking any trade.
intraday midcap stocks are going to boom
there is possibility for big move
instead of intraday its better to go for 3 to 4 days of holding
with proper risk management

watch MGL for massive for 1 day move in coming weekNSE:MGL #MGL has become sideways at previous high level/previous resistance on daily timeframe and it is trading in the same range in which it was stuck before crashing massively,
if MGL crosses 1030 level or opens above it, we might see a sudden rise of 5%+ move in a single day ,
ih it goes below 1000 again, we might see downside move again, watch both levels closely for breakout

MGL Swing TradeExcellent breakout of resistance zone.
Price is getting accepted above resistance zone. Making Flag Pattern.
Entry above Breakout candle - 1000
Stop below Breakout candle - 915
Target All Time High(1200) and more.
