MINDAMINDA, Is in momentum, but before testing its extreme poi , it cant move for long, so wait for it, lets see what will happen
Next report date
—
Report period
—
EPS estimate
—
Revenue estimate
—
11.05 INR
2.27 B INR
46.35 B INR
84.00 M
About MINDA CORPORATION LTD
Sector
Industry
CEO
Ashok Minda
Website
Headquarters
Noida
Founded
1985
ISIN
INE842C01021
FIGI
BBG002CX71K7
Minda Corp. Ltd. engages in the manufacture of automotive components. It provides electronic and mechanical security system to two-wheelers, three-wheelers, and off-road vehicles. The firm offers safety, security, and restraint system, driver information telematics system, interior system, and after market products. The company was founded by Shadi Lal Minda on March 11, 1985 and is headquartered in Noida, India.

MINDA CORP 1DEntry Zone:
The current price action shows a potential reversal after a change of character (CHOCH) around the ₹540-550 range. The price is approaching the break of structure (BOS) and could retest the zone before moving higher.
Entry Point: A buy entry can be placed around the current consolidatio

Long- MindacorpLarge base 3months+ VCP characteristics
Long tail-shakeout at 50 DEMA
good for short to medium term- new trend

MINDACORP BREAK OUT WITH VOLUMEMINDACORP BREAK 435 RESISTANCE LEVEL AFTER LONG CONSOLIDATION OF 3 MONTH. MINDA CORP SUSTAINS ABOVE LEVEL WITH VOLUME.
TARGET 1 - 458
TARGET 2 - 500
TARGET 3 - 530
FOLLOW RISK REWARD
Disclaimer -
videos, presentations, and writing are only for educational purposes and are not intended for inves


EXPECTED IMPORTANT DIRECTIONAL LEVELS FOR THE YEAR Hey Folks..!
I have marked all the important directional level for this year.
All the levels have the description, Bullish movements is expected in bullish range and Downside is expected in the bearish range.
Use the levels either Standalone or Club these levels with your existing trading style & s

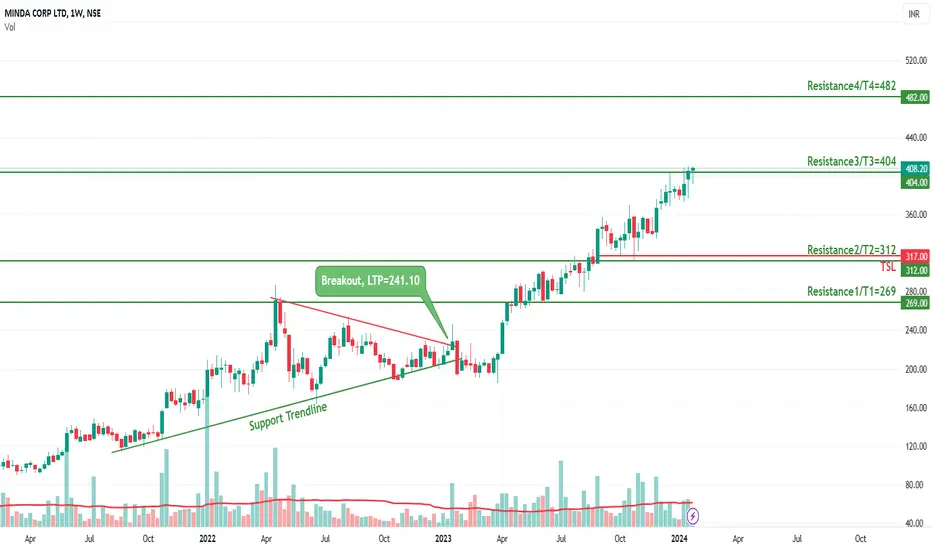
MINDACORP - Long Setup, Move is ON..NSE:MINDACORP
✅ #MINDACORP trading above Resistance of 404
✅ Next Resistance is at 482
Related charts:
Charts are self-explanatory. Levels of breakout, possible up-moves (where stock may find resistances) and support (close below which, setup will be invalidated) are clearly defined.
D
Big Breakout In Minda CorporationBuy Minda Corporation At Cmp 308.85
SL - 270 ( Weekly Closing Basis )
Target - 390/405

Ascending triangle breakout - MINDACORPPlease look into the chart for a detailed understanding.
Consider these for short-term & swing trades with 2% profit.
For BTST trades consider booking
target for 1%-2%
For long-term trades look out for resistance drawn above closing.
Please consider these ideas for educational purpose
Please n

MINDACORP Bullish; above 375.5 on Wednesday 30 Nov. The above information does not constitute investment/trading recommendation and it is purely for educational purpose. Please check the Strategy below...
SWING Trading Strategy:
Position is created, only upon stock closing above the entry price on day closing basis and is held on for 5-10 trad

See all ideas
An aggregate view of professional's ratings.
Displays a symbol's price movements over previous years to identify recurring trends.
Frequently Asked Questions
The current price of MINDACORP is 528.10 INR — it has decreased by −1.94% in the past 24 hours. Watch MINDA CORPORATION LIMITED stock price performance more closely on the chart.
Depending on the exchange, the stock ticker may vary. For instance, on BSE exchange MINDA CORPORATION LIMITED stocks are traded under the ticker MINDACORP.
MINDACORP stock has risen by 5.27% compared to the previous week, the month change is a 5.55% rise, over the last year MINDA CORPORATION LIMITED has showed a 36.81% increase.
We've gathered analysts' opinions on MINDA CORPORATION LIMITED future price: according to them, MINDACORP price has a max estimate of 580.00 INR and a min estimate of 531.00 INR. Watch MINDACORP chart and read a more detailed MINDA CORPORATION LIMITED stock forecast: see what analysts think of MINDA CORPORATION LIMITED and suggest that you do with its stocks.
MINDACORP reached its all-time high on Aug 26, 2024 with the price of 652.90 INR, and its all-time low was 52.60 INR and was reached on Apr 3, 2020. View more price dynamics on MINDACORP chart.
See other stocks reaching their highest and lowest prices.
See other stocks reaching their highest and lowest prices.
MINDACORP stock is 3.38% volatile and has beta coefficient of 1.10. Track MINDA CORPORATION LIMITED stock price on the chart and check out the list of the most volatile stocks — is MINDA CORPORATION LIMITED there?
Today MINDA CORPORATION LIMITED has the market capitalization of 126.26 B, it has increased by 2.59% over the last week.
Yes, you can track MINDA CORPORATION LIMITED financials in yearly and quarterly reports right on TradingView.
MINDA CORPORATION LIMITED is going to release the next earnings report on Feb 6, 2025. Keep track of upcoming events with our Earnings Calendar.
MINDACORP net income for the last quarter is 743.40 M INR, while the quarter before that showed 642.00 M INR of net income which accounts for 15.79% change. Track more MINDA CORPORATION LIMITED financial stats to get the full picture.
MINDA CORPORATION LIMITED dividend yield was 0.33% in 2023, and payout ratio reached 14.50%. The year before the numbers were 0.56% and 9.91% correspondingly. See high-dividend stocks and find more opportunities for your portfolio.
As of Dec 15, 2024, the company has 18.61 K employees. See our rating of the largest employees — is MINDA CORPORATION LIMITED on this list?
EBITDA measures a company's operating performance, its growth signifies an improvement in the efficiency of a company. MINDA CORPORATION LIMITED EBITDA is 5.47 B INR, and current EBITDA margin is 10.95%. See more stats in MINDA CORPORATION LIMITED financial statements.
Like other stocks, MINDACORP shares are traded on stock exchanges, e.g. Nasdaq, Nyse, Euronext, and the easiest way to buy them is through an online stock broker. To do this, you need to open an account and follow a broker's procedures, then start trading. You can trade MINDA CORPORATION LIMITED stock right from TradingView charts — choose your broker and connect to your account.
Investing in stocks requires a comprehensive research: you should carefully study all the available data, e.g. company's financials, related news, and its technical analysis. So MINDA CORPORATION LIMITED technincal analysis shows the buy rating today, and its 1 week rating is buy. Since market conditions are prone to changes, it's worth looking a bit further into the future — according to the 1 month rating MINDA CORPORATION LIMITED stock shows the buy signal. See more of MINDA CORPORATION LIMITED technicals for a more comprehensive analysis.
If you're still not sure, try looking for inspiration in our curated watchlists.
If you're still not sure, try looking for inspiration in our curated watchlists.