Buy Monte CarloAnyone interested to buy Monte Carlo based on inverted head shoulder pattern with a target and stoploss as shown in chart.
Trade ideas

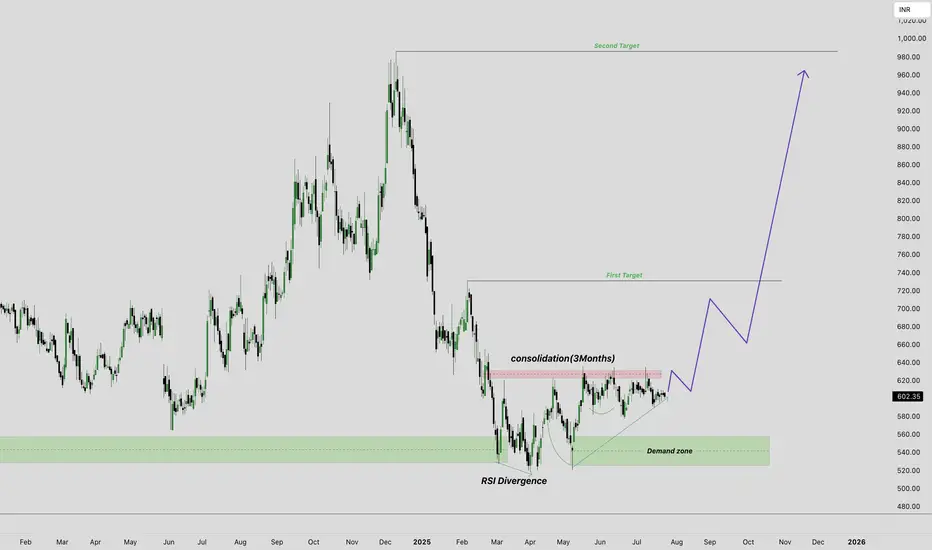
Monte Carlo Near break outMonte Carlo is consolidating between 550 to 640 price range. recent few weeks this range has become narrow, or forming VCP like structure. Which good sign for long term and swing investor.
If Monte Carlo fail to sustain this breakout at level of 640. it can test nearest demand zone which is near 550 level.
Key level entry and stop loss:
1. 640 breakout level. this level is good area for breakout and vcp trader with SL 580 or 570
2. if price fail to sustain this breakout it can test 550 demand zone at this demand you can make entries with some convictions and with some confluence, put sl below this demand zone.
Please do your own research and check your own confluence before making any finacial decisions.
ready for targets MONTE CARLOMonte Carlo Fashions Ltd., incorporated in the year 2008, is a Small Cap company (having a market cap of Rs 1,892.11 Crore) operating in Apparels sector.
Monte Carlo Fashions Ltd. key Products/Revenue Segments include Textiles and Other Operating Revenue for the year ending 31-Mar-2024.
For the quarter ended 30-09-2024, the company has reported a Consolidated Total Income of Rs 228.87 Crore, up 71.72 % from last quarter Total Income of Rs 133.28 Crore and up 4.79 % from last year same quarter Total Income of Rs 218.40 Crore. Company has reported net profit after tax of Rs 8.04 Crore in latest quarter.
The company’s top management includes Mr.Jawahar Lal Oswal, Mrs.Monica Oswal, Mr.Rishabh Oswal, Mrs.Ruchika Oswal, Mr.Sandeep Jain, Mr.Dinesh Gogna, Mr.Alok Kumar Misra, Mr.Manikant Prasad Singh, Dr.Manisha Gupta, Mr.Parvinder Singh Pruthi, Dr.Roshan Lal Behl, Dr.Suresh Kumar Singla, Dr.Anchal Kumar Jain, Mr.Bhuwanchandra Balkrishna Joshi, Dr.Yash Paul Sachdeva, Mr.Raj Kapoor Sharma, Mr.Ankur Gauba. Company has Deloitte Haskins & Sells as its auditors. As on 30-09-2024, the company has a total of 2.07 Crore shares outstanding.
Monte Carlo Fashion Share Price Today is Rs. 951.60 as on 09 Dec, 2024, 12:26 PM IST. On previous day, the Monte Carlo Fashion Share Price (NSE) closed at Rs. 929.25, featuring among the most traded securities on the National Stock Exchange.

#MONTECARLO - ATH BreakOut in Weekly chart📊 Script: MONTECARLO
Key highlights: 💡⚡
📈 Draves Box BreakOut in Weekly chart.
📈 Price gave a good up move and consolidated before BO.
📈 Volume spike on Breakout
📈 MACD Cross Over
📈 One can go for Swing Trade.
BUY ONLY on Friday (6 Dec’24) ABOVE 390 WCB
⏱️ C.M.P 📑💰- 280
🟢 Target 🎯🏆 – 28%
⚠️ Stoploss ☠️🚫 – 14%
⚠️ Important: Always Exit the trade before any Event.
⚠️ Important: Always maintain your Risk & Reward Ratio.
✅Like and follow to never miss a new idea!✅
Disclaimer: I am not SEBI Registered Advisor. My posts are purely for training and educational purposes.
Eat🍜 Sleep😴 TradingView📈 Repeat 🔁
Happy learning with MMT. Cheers!🥂

MONTE CARLO FASHIONS Approaching Multi-Year Resistance The stock is nearing its multi-year resistance level around 950, which has acted as a major hurdle in the past. A decisive breakout above this level could open doors for a strong upward rally.RSI is at 69, indicating bullish momentum with room to push higher. Recent price action is supported by consistent volume, signaling strong buying interest.The long-term trendline support near ₹600 has provided a strong base for the uptrend. Sustained movement above 950 with rising volumes will confirm the breakout, potentially leading the stock toward 1100 levels.

MONTECARLO bullish above 920..?? - 15 October.MONTECARLO: Bullish if ~2 Year long consolidation range is broken on good volumes and sustains.
The above information does not constitute investment/trading recommendation and it is purely for educational purpose....
INTRADAY Trading Strategy in 3 stages of breakouts:
1) Impulse upmove stage: The strong upmove (nearly upto 1.5% from trigger-price) happens within five minutes. "High Risk Traders" buy on breakouts in hope of continuation of upmove. "High Risk Traders" may have to patiently wait through the Pullback-Consolidation stage to realize profits. High risk:High reward set up as breakouts may fakeout (reversal)also
2) Pullback-Consolidation stage: After the above "Impulse upmove stage"; the price may then pull back and move sideways (between "Open" price and "High" of the above "Impulse upmove stage"). "Safe traders" with minimum risk profile wait for a breakout from the consolidation stage to enter into trade , to book high profits in the final "Breakout continuation" stage
3) Breakout continuation: Stocks often in the third stage breaks up above the "High" of the first "Impulse upmove stage" and continue to go higher again.(another 2-3%)
Both Safe Traders/High Risk Traders book profits at this stage
SWING Trading Strategy:
Position is kept open, only upon stock closing above the entry price on day closing basis and is held on for 5-10 trading sessions for larger gains (5-10%)
The above information do not constitute, financial, investment, trading, or other types of advice or recommendation. It is purely for educational purpose....

MONTECARLO (Near breakout level)Need closing above 930
Ny target is the PRZ Zone.
RSI is also making a trendline resistance.
After breakout of trendline It gains momentum.
I am not a SEBI Registered. This analysis is purely for educational purposes only.
.
If you gain some learning from this chart, then please like this post for more reach & also do comment if you have any questions regarding this.

Long Term ViewMonteCarlo Strong Long Term View
Support Zone/Buying Zone 679-598
The target mentioned on Chart
Strictly follow SL (View invalid if below SL)

MONTE CARLO SHOWING SIGNS OF REVERSALThe stock has been forming a cup and handle pattern , the cup has been formed already and the handle formation is underway , it can provide great returns as it posted good quarter recently and can reach to 900 levels

Monte Carlo fashion📊Monte Carlo Fashion (MONTECARLO) CMP:756.90
Trend :- Bearish + Near Support Zone 👀
#montecarlo #StockMarket #stockstowatch

MONTE CARLO GOOD FOR SWING TRADE The stock has taken a stong resistance at the 743 levels and can reach 881 levels in no time . this stock is good for range bound and momentum trading

BREAKOUT IN MONTECARLOMONTECARLO, closed above 807 on 10.10.2023. Buy at open on 11.10.2023.
Target- 1031
Sloploss- Close below 756
Risk: Reward- 1:3.9

MONTE CARLO FORMING CUP AND HANDLE PATTERNthe stock is forming a cup and handle and has a very strong aand smooth fundamentals

Montecarlo seems BullishMontecarlo seems Bullish
Entry : 790 - 800
SL: 770
Expected Targets: 809 / 830 / 870

MONTECARLO - Reversal PatternDAILY CHART ANALYSIS OF NSE:MONTECARLO
The Diamond Bottom pattern, also known as the Diamond Reversal pattern , is a technical chart pattern frequently used in technical analysis to identify potential trend reversals in financial markets, such as stocks, forex, and commodities. It is a rare pattern and is considered a reversal pattern, indicating a potential change in the direction of the prevailing trend.
Here are the key characteristics of the Diamond Bottom pattern:
Formation: The Diamond Bottom pattern typically occurs after a prolonged downtrend, signaling that the existing bearish trend may be coming to an end.
Shape: The pattern resembles a diamond shape on the price chart, with two converging trendlines – one representing the upper highs (resistance) and the other representing the lower lows (support). These trendlines create a diamond-like shape on the chart.
Duration: The pattern usually takes several weeks to form, and it can be seen as a period of consolidation or indecision in the market.
Volume: The volume tends to diminish as the pattern forms, indicating uncertainty or indecision among traders.
Breakout: The breakout from the Diamond Bottom pattern is significant. When the price breaks above the upper trendline (the resistance line), it suggests a potential bullish reversal, and traders may consider buying. Conversely, if the price breaks below the lower trendline (the support line), it could indicate a continuation of the downtrend.
Price Target: To estimate a price target for a bullish breakout, measure the height of the diamond from the highest point to the lowest point of the pattern and add that distance to the breakout point. For a bearish breakout, subtract the same distance from the breakout point.
Confirmation: It's important to look for additional confirmation signals, such as bullish candlestick patterns or other technical indicators, to increase the reliability of the pattern.
Remember that not all Diamond Bottom patterns result in trend reversals. Like all technical patterns, it's essential to use other analysis tools and indicators to confirm the signal. Traders often use stop-loss orders to manage risk when trading based on this pattern since false breakouts can occur.
As with any technical analysis pattern, it's crucial to consider the broader market context, news events, and other factors that can impact the price of the asset you're trading. Additionally, patterns like the Diamond Bottom are more reliable when they occur on higher timeframes, such as daily or weekly charts, as opposed to shorter intraday timeframes.
PLEASE NOTE THAT:
This chart analysis is only for reference purpose.
This is not buying or selling recommendations.
I am not SEBI registered.
Please consult your financial advisor before taking any trade.

Control your EmotionsThe price must sustain above 900 to confirm the pattern BO. Anything before that would be impulsive.
How many of us would let the trade develop and wait patiently for the BO to happen ?
90% of us or 10% ... Trading is not very well suited to impulsive behavior.
"Every day I go in without an opinion, and let the market tell me where it wants to go.
Opinions are what get you in trouble."
- Angel

MONTECARLO | SwingDisclaimer: This analysis is solely for educational purposes and does not make me a SEBI registered analyst.
If you found this analysis helpful, I encourage you to like and share it. Your observations and comments are also welcomed below. Your support, likes, follows, and comments motivate me to consistently share valuable insights with you.
🔍 More Analysis & Trade Setups 🔍
For more technical analysis and trade setups, make sure to follow me on TradingView: www.tradingview.com

Such volatility in this week candle. but rest assured 1000+1000+ on the way guys. the stock has tried to cross its previous resistance and has given weekly close just near this. i expect a gapup opening on monday followed by a close above 800 which will clearly start the trend in this stock to move 1000+.

Montecarlo strong buy at 580 This stock is in good demand zone and having good potential to move upwards ..Strong buy

MONTECARLO - SWING TRADEEntry - 800
Target - 970
SL - 765
EMA 10 > EMA 21 > EMA 50 > EMA 150 > EMA 200
Price brokeout the 8 month long consolidation and retested the Break out

MONTECARLO breakout with good volumeMONTECARLO breakout with good volume on a daily time frame, one can add at this level with SL @ 615 on daily closing basis TGT1 : 665, TGT2 : 698
Note : It's your hard earned money always trade with SL, I'm just sharing my analysis

MONTO CARLO-SHORT~Monto Carlo has lost its upside momentum.
~S.L. is triggered in monto carlo.
~It is trading below the uptrend line.
~link of the previous chart is given below.

BUY MONTE CARLOBuy Monte carlo 700, till 580 for 950,1050. Double bottom made at 450 range and stock is regularly surging higher. Today at 700 is highest weekly close. Exit if falls below 450 on weekly closing basis.
