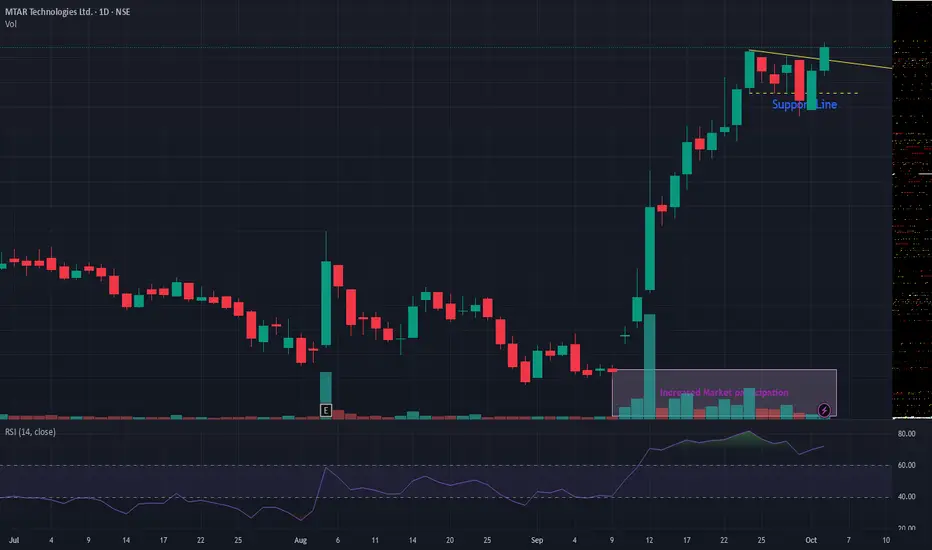
MTARTECHMTARTECH giving trend-line breakout. VCP breakout also observed. Volume too has spiked. As long as it is above support line, the stock seems attractive. Many defense stocks are showing strength and trying to give a run! Keep in your watchlist
MTARTECH trade ideas
BUY TODAY SELL TOMORROW for 5%DON’T HAVE TIME TO MANAGE YOUR TRADES?
- Take BTST trades at 3:25 pm every day
- Try to exit by taking 4-7% profit of each trade
- SL can also be maintained as closing below the low of the breakout candle
Now, why do I prefer BTST over swing trades? The primary reason is that I have observed that 90% of the stocks give most of the movement in just 1-2 days and the rest of the time they either consolidate or fall
Resistance Breakout in MTARTECH
BUY TODAY SELL TOMORROW for 5%

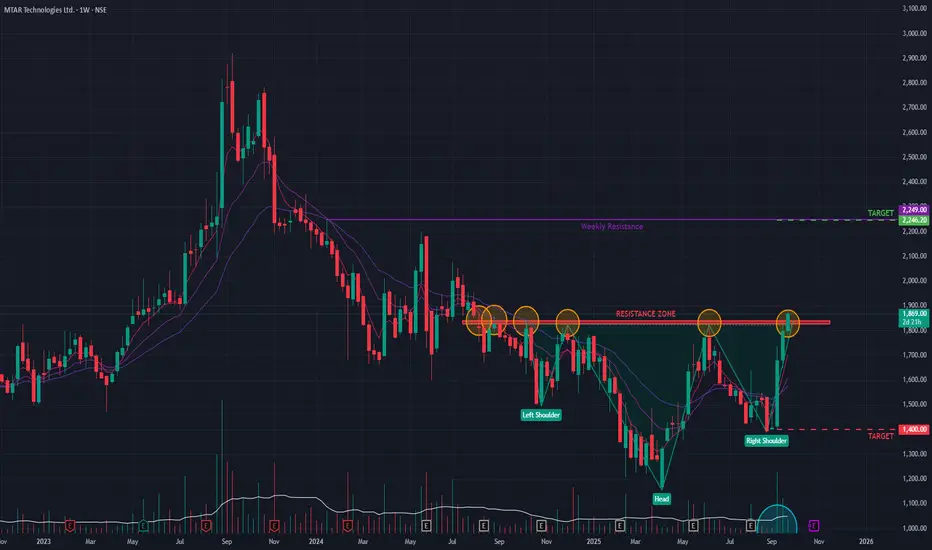
MTAR Tech (W) - Signals Bullish Reversal with Pattern BreakoutMTAR Tech has shown a significant sign of a potential long-term trend reversal. The stock, which has been in a prolonged downtrend since its All-Time High in September 2023, has decisively broken out of an Inverse Head & Shoulders pattern on the weekly chart today.
This classic bullish reversal pattern was confirmed by a strong upward move that breached the neckline, supported by decent trading volume .
Multi-Timeframe Confirmation 👍
The bullish thesis is strongly supported by momentum indicators across all major timeframes:
- Broad Momentum: The Relative Strength Index (RSI) is in a bullish crossover state on the monthly, weekly, and daily charts , indicating synchronized positive momentum.
- Volume Trend: The general trend of building volume suggests increasing buyer participation and conviction in the upward move.
Future Outlook and Key Levels
The breakout from this major reversal pattern suggests the downtrend that began in mid-2023 may be over. The price action in the coming days will be crucial for confirmation.
- Bullish Case 📈: If the breakout momentum is sustained, the stock could be on a path toward the next major resistance level near ₹2,245 .
- Bearish Case 📉: However, if the breakout fails to hold and momentum wanes, the stock could pull back to test support around the ₹1,400 level.
MTAR Technologies: The hidden giant behind space & clean Energy NSE:MTARTECH
🏢 Company Overview:
MTAR Technologies Ltd is a precision engineering company catering to high-value, mission-critical sectors such as:
Clean Energy (Hydrogen, Nuclear, etc.)
Space & Defence
Aerospace
They manufacture critical components like fuel cells, nuclear reactor parts, aerospace engines, and satellite launch system parts.
📈 Fundamental Analysis:
✅ Key Financials (FY24-25 Estimates):
Market Cap : ₹6,500+ Cr
Revenue (FY24) : ₹650 Cr+
EBITDA Margin : ~28-30%
PAT Margin : ~15%
ROE / ROCE : 15-18% / 20%+
Debt to Equity : 0.1 (Very low)
P/E Ratio : ~45x (Premium)
🧩 Strengths:
Strong order book from ISRO, DRDO, BHEL, and international clean energy players like Bloom Energy.
Technological moat in nuclear & space-grade precision engineering.
Low debt, high return ratios—financials are robust.
Entering Hydrogen & Fuel Cell space—a big long-term catalyst.
⚠️ Risks:
Dependency on a few clients (Bloom Energy being a major one).
Volatility in clean energy adoption pace.
High valuation – priced for growth.
📊 Technical Analysis (As of July 2025):
🧾 Price Action Summary:
CMP: ₹2,050 (Example)
52-Week Range: ₹1,250 – ₹2,150
Trend: Bullish continuation from March 2025
Support Zone: ₹1,860 – ₹1,950
Resistance: ₹2,150 (all-time high breakout zone)
🔍 Indicators:
200 EMA: ₹1,620 (Stock trading well above 200 EMA)
MACD: Bullish crossover on daily chart
RSI: ~67—momentum strong but near overbought zone
Volume: Rising steadily with price—confirms strength
📉 Short-Term View:
Healthy consolidation expected around ₹2,000–₹2,150
A breakout above ₹2,150 could lead to ₹2,400–₹2,600 zone
🚀 Future Growth Prospects:
🔬 1. Clean Energy Boom:
Supplying parts to Bloom Energy (US-based Fuel Cell firm).
India’s green hydrogen policy and PLI schemes can benefit MTAR.
🛰️ 2. Space & Defense:
Increasing budgets in defense, ISRO’s new missions, and India’s entry into private space programs can drive long-term orders.
💹 3. Export Potential:
MTAR is entering global markets for nuclear and aerospace precision components.
USD-denominated revenues provide a hedge and higher margins.
🌱 4. Capex & Expansion:
New manufacturing facility in Adibatla, Telangana.
Capex being done to triple capacity in the coming 3–5 years.
📝 Conclusion:
Parameter Verdict
Fundamentals 🔵 Strong (Clean Balance Sheet, Healthy Margins)
Technicals 🟢 Bullish (But Near Resistance)
Valuation 🟡 Slightly Overvalued (but justified by growth)
Long-Term View ✅ Positive – Multiyear structural story
Short-Term View 🔄 Wait for consolidation or breakout above ₹2,150
⚠️ Disclaimer:
This analysis is for educational and informational purposes only.
We are not SEBI-registered analysts or advisors.
This is our personal view based on available data and market trends.
Please consult your SEBI-registered investment advisor before making any investment or trading decisions.
You are solely responsible for any financial decisions you make based on this content.
========================
Trade Secrets By Pratik
========================
Tools
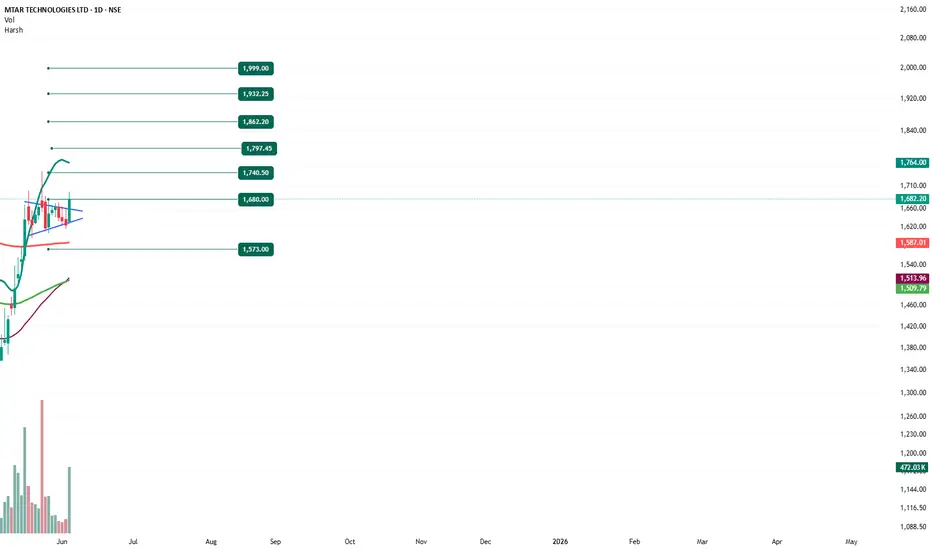
MTAR TECHNOLOGIES - Bullish Flag & Pole Breakout (Daily T/F)Trade Setup
📌 Stock: MTAR TECHNOLOGIES LTD ( NSE:MTARTECH )
📌 Trend: Strong Bullish Momentum
📌 Risk-Reward Ratio: 1:3 (Favorable)
🎯 Entry Zone: ₹1680.00 (Breakout Confirmation)
🛑 Stop Loss: ₹1573.00 (Daily Closing Basis) (-6.3% Risk)
🎯 Target Levels:
₹1740.50
₹1797.45
₹1862.20
₹1932.25
₹1999.00 (Final Target)
Technical Rationale
✅ Bullish Flag & Pole Breakout - Classic bullish pattern confirming uptrend continuation
✅ Strong Momentum - Daily, Weekly & RSI >60 (Bullish zone)
✅ Volume Confirmation - Breakout volume 472.5K vs previous day's 98.43K (Nearly 4.7x surge)
✅ Multi-Timeframe Alignment - Daily and weekly charts showing strength
Key Observations
• The breakout comes with significantly higher volume, validating strength
• Well-defined pattern with clear price & volume breakout
• Conservative stop loss at recent swing low
Trade Management Strategy
• Consider partial profit booking at each target level
• Move stop loss to breakeven after Target 1 is achieved
• Trail stop loss to protect profits as price progresses
Disclaimer ⚠️
This analysis is strictly for educational purposes and should not be construed as financial advice. Trading in equities involves substantial risk of capital loss. Past performance is not indicative of future results. Always conduct your own research, consider your risk appetite, and consult a financial advisor before making any investment decisions. The author assumes no responsibility for any trading outcomes based on this information.
What do you think? Are you watching NSE:MTARTECH for this breakout opportunity? Share your views in the comments!
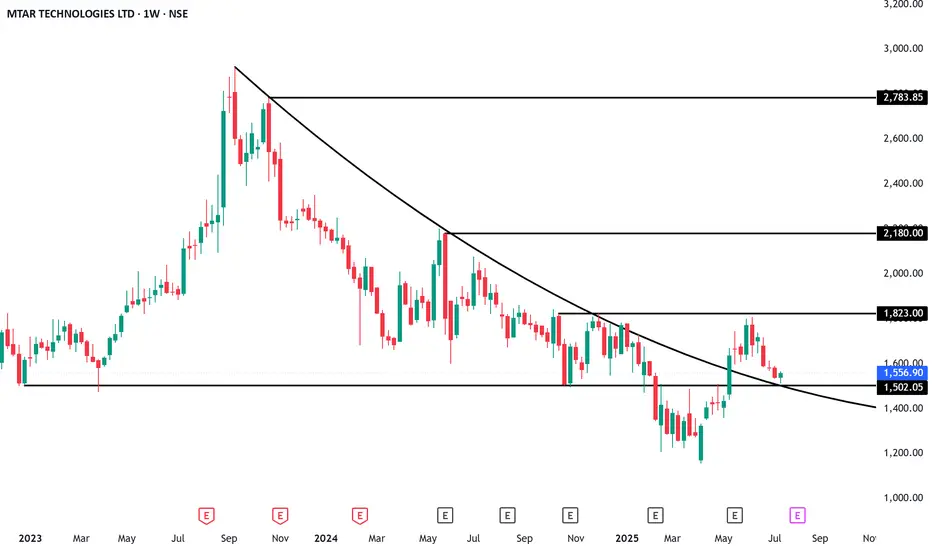
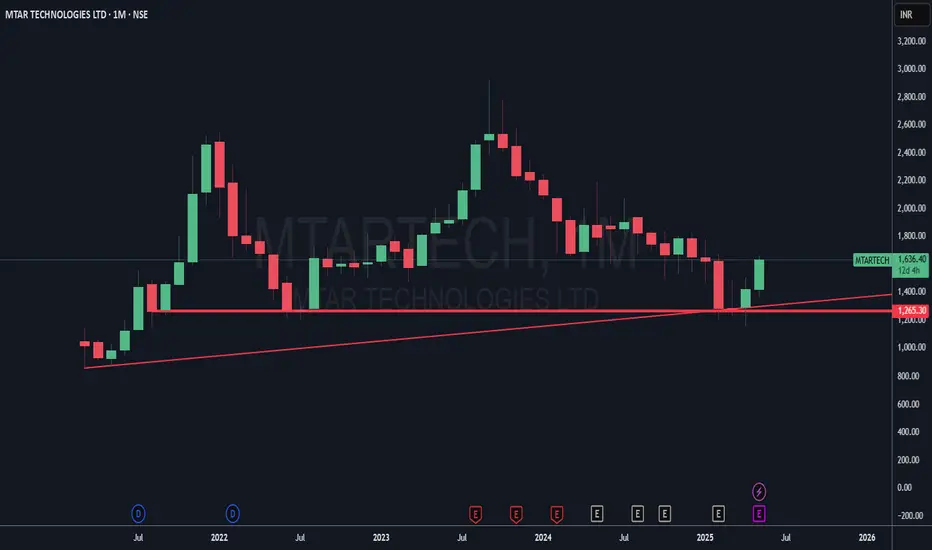
Trend line I think this stock breakout Trend line daily, weekly and monthly charts and this stock recovery from support levels see line diagram.
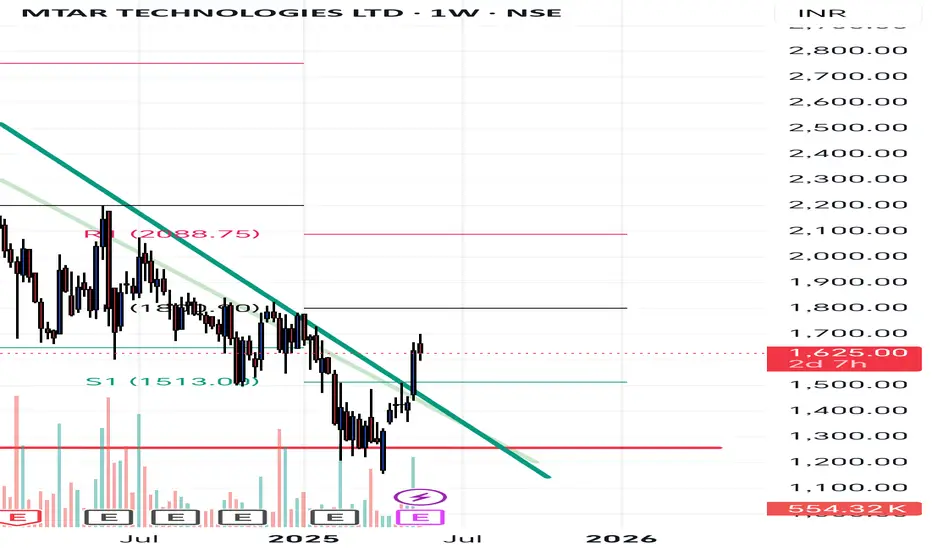
Building Nation With Exceptional EngineeringMTAR Technologies - CMP 1636
MTAR develops and manufactures components and equipment for the defense, aerospace, nuclear and clean energy sectors. The company was incorporated in 1970 by the promoters, Mr PR Reddy, Mr KSN Reddy and Mr PJ Reddy, to cater to the technical and engineering needs of the Indian government in the post embargo regime. MTAR has manufacturing footprints in Hyderabad with seven units spread across a 4 km radius and a dedicated export facility as well.
In addition, the company also supplies specialised products such as Ball Screws, Water Lubricated Bearings, Roller Screws, Electro-Mechanical Actuation Systems, ASP assemblies etc. that find applications across diverse sectors.
This is just to boost my confidence. No Suggestions for buying.
Disclosure: I am not SEBI registered. The information provided here is for educational purposes only. I will not be responsible for any of your profit/loss with these suggestions. Consult your financial Adviser before making any decisions.
MTAR Technologies Ltd., Inverted Head and Shoulder PatternKey Observations:
Pattern Structure:
Left Shoulder: Formed as the price dipped and rebounded.
Head: A deeper dip, followed by a recovery, forming the head of the pattern.
Right Shoulder: A final dip, higher than the head, completing the structure.
The neckline (resistance line) is slanted slightly upwards, showing gradual bullish sentiment.
Breakout:
Once the price breaks above the neckline with strong volume, the pattern is confirmed.
This breakout is expected to lead to the projected target.
Target Projection:
Height of the pattern (from the head to the neckline): Approx. 660 points.
Adding this to the breakout level (neckline at ~1,500), the target is estimated at 2,160 INR, indicating a 39.73% upside.
Current Price:
Trading around 1,637 INR, slightly above the breakout region.
It’s crucial to watch if the breakout sustains above the neckline.
Volume Analysis:
Volume during the breakout is critical for confirming strength.
Rising volume would indicate buyer conviction.
Technical Implications:
Bullish Sentiment: The Inverted Head and Shoulders is a strong bullish reversal pattern, often signaling the end of a downtrend.
Support Levels:
1,495 INR: Key support below the neckline.
1,565 INR: Intermediate support.
Resistance Levels: The immediate target is 2,160 INR, but resistance may appear near 1,900 INR on the way up.
Potential Trading Strategy:
Entry: On a confirmed breakout above the neckline, around 1,650 INR.
Stop Loss: Place below the neckline at 1,495 INR for risk management.
Target: Aim for 2,160 INR, aligning with the pattern's projected move.
Risk Factors:
If the price falls below the neckline (around 1,495 INR), the bullish setup may invalidate.
Macro factors or sector-specific news could impact momentum.

MTAR Technologies Ltd view for Intraday 23rd Dec #MTARTECH
MTAR Technologies Ltd view for Intraday 23rd Dec #MTARTECH
Resistance 1740 Watching above 1744 for upside movement...
Support area 1700 Below 1720 ignoring upside momentum for intraday
Support 1700 Watching below 1695 or downside movement...
Resistance area 1740
Above 1720 ignoring downside move for intraday
Charts for Educational purposes only.
Please follow strict stop loss and risk reward if you follow the level.
Thanks,

RH&S PATTERNIt's pure technical swing trade,
RH&S PATTERN
Pullback support by two green candles pattern
Target up to 24%

one day affairRange contraction + volume contraction after big bullish candle breakout. Retest may give good risk: reward ration entry oppportunity.

MTARTECH - Long SignalR/R details are mentioned in chart and this is for Long term..
** I AM NOT SEBI registered advisor please consult financial advisor for your investment.
**This is only for educational purpose you can also share your thoughts on the comments
MTARTECH - Breakout and price at support line1500 range act as good support line for this stock since 2021 and it reaches the same range in October. Solid green candle formed inside red candle at the end of October in Weekly Timeframe and the price is breakout the falling wedge pattern by today.

Volumes have dried on long term chart viewStock has in been downtrend with healthy correction.
Candles are big however the volumes are low.
Disclaimer: View for Education only, not to be taken as trading or investment advice.

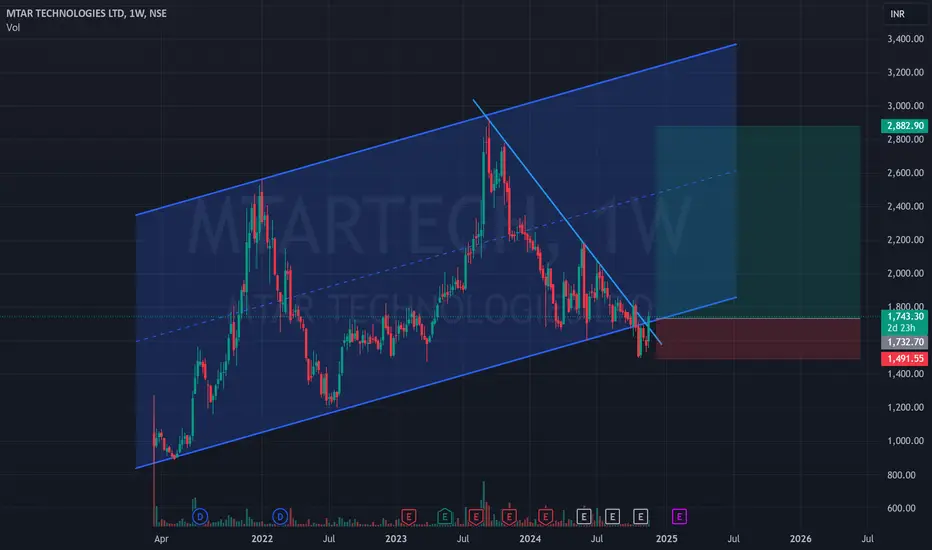
MTARTECH is LONG....!!
MTARTECH looks strong..
SL is below 1600 rs.
Target can be around 2850 rs.
Risk/Reward is mentioned in the chart.

MACD Crossover - MTARTECH📊 Script: MTARTECH
📊 Sector: Aerospace & Defense
📊 Industry: Engineering
Key highlights: 💡⚡
📈 Script is trading at middle band of BB.
📈 MACD is giving crossover.
📈 Script may fill the gap.
📈 Right now RSI is around 50.
📈 One can go for Swing Trade.
⏱️ C.M.P 📑💰- 1911
🟢 Target 🎯🏆 - 2071
⚠️ Stoploss ☠️🚫 - 1828
⚠️ Important: Always maintain your Risk & Reward Ratio.
✅Like and follow to never miss a new idea!✅
Disclaimer: I am not SEBI Registered Advisor. My posts are purely for training and educational purposes.
Eat🍜 Sleep😴 TradingView📈 Repeat 🔁
Happy learning with trading. Cheers!🥂

SHORT TERM SWING OPPORTUNITY IN MTAR TECHNOLOGIES LTD."MTAR TECHNOLOGIES LTD" is about to change it's weekly structure with a trendline support valid since 2021. Confirmation is above 2200 on closing basis. If the trade goes as planned, it is going to give a return of almost15% which is good. Stop loss will be planned once entry is activated. Target is calculated using the XABCD Pattern of Harmonics. Profit should be booked between 2500 and 2543 as it happens to be the PRZ area of the XABCD Pattern. Above 2600, it is going to test it's ATH again.

MTAR Technologies Ltd - Breakout OpportunityDate : 21-May-2024
Rating : Buy - Positional Trade
LTP : Rs. 2,110.35
Targets: (1) Rs. 2,320 --> (2) Rs. 2,475 --> (2) Rs. 2,563
SL : Rs. 1,910 on daily close basis
Technical View:
• NSE:MTARTECH was moving in its primary downtrend since Sep-2023.
• After touching the lifetime high of 2,920 on 11-Sep-2023, it has retraced 43% to 1,661 level.
• On 21-May-2024, NSE:MTARTECH has broke out from its primary down trend with higher than average volume.
• Since 17-May-2024, NSE:MTARTECH is trading above 20 DMA, 50 DMA and 21 DEMA.
• RSI is trading at 75.36 and MACD is trading at 38.04.
• Both RSI and MACD is showing positive divergence on daily timeframe indicating a trend reversal.
Disclaimer : I am not a SEBI registered analyst/consultant and not recommending anyone to take any BUY or SELL position in stock market. Investing in stock market is risky and one should do a self analysis and validation before investing in stock market. Ideas are published for learning purpose only.

MTAR: Becoming bullish 📈 after long correction For educational purpose only.
If it corrects further from this point, drawn channel can be act as support and one can average the price for more potential.

MTAR: Becoming bullish after long correction For educational purpose only.
If it corrects further from this point, drawn channel can be act as support and one can average the price for more potential.

Buy MTARTechAfter looking at the all technical moving avg. and the volume divergence, and there was a trend breakout. As per my knowledge its time to Buy
Targets:
2210 immediate in next week
2353 hold for 25 days
2590 6 month hold
Note: it is just a knowledge sharing, not suggestion to buy hold or sell

BUY MTAR TECHNOLOGIES LTD I AM LOOKING FOR BUY MTARTECH AT RETRACMENT LEVEL 0.618 .Which is a good buy position for longterm

MTAR Tech - Good Above 2010.MTAR Tech : Defence theme doing well.
Buy only above 2010, and top up as it moves up. Don't rush to buy this now.
Stop Loss : 1785.
Pro Tip : Keep Alert for 2010 in your trading account, and when you see supported volumes. understand your trade is going to be right.
Disclaimer : Educational Content. Trading is a probability game. Please do your own research before taking a call.
