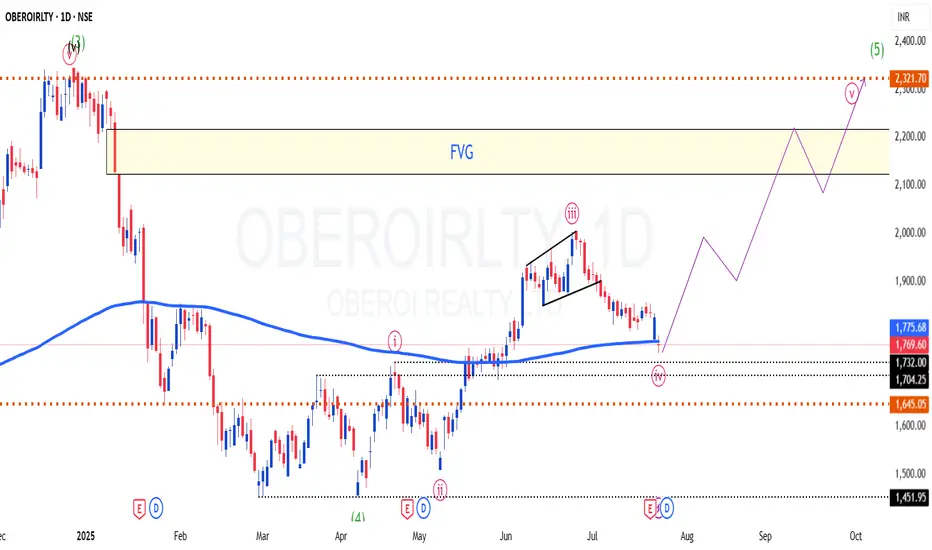
OBEROIRLTY - Low Risk Long Set upObservation:
On Daily TF,
Price is taking support at 200 EMA
Price is taking support at the cloud
Price is taking support at the SuperTrend
Pinbar candle formed at the previous Base
Today's volume activity (23rd July) suggests/hints at an end of correction/start of a new upmove
EW Counts/Assum
Next report date
—
Report period
—
EPS estimate
—
Revenue estimate
—
56.70 INR
22.26 B INR
53.96 B INR
117.43 M
About Oberoi Realty Limited
Sector
Industry
CEO
Vikas Ranvir Oberoi
Website
Headquarters
Mumbai
Founded
1998
ISIN
INE093I01010
FIGI
BBG000Q69MW4
Oberoi Realty Ltd. is a real estate development company. The firm focuses on premium developments in the residential, office space, retail, hospitality, and social infrastructure verticals. It operates through the Real Estate and Hospitality segments. The Real Estate segment develops and sells residential properties and lease commercial properties. The Hospitality segment involves in the business of managing the hotel. The company was founded on May 8, 1998 and is headquartered in Mumbai, India.
Related stocks
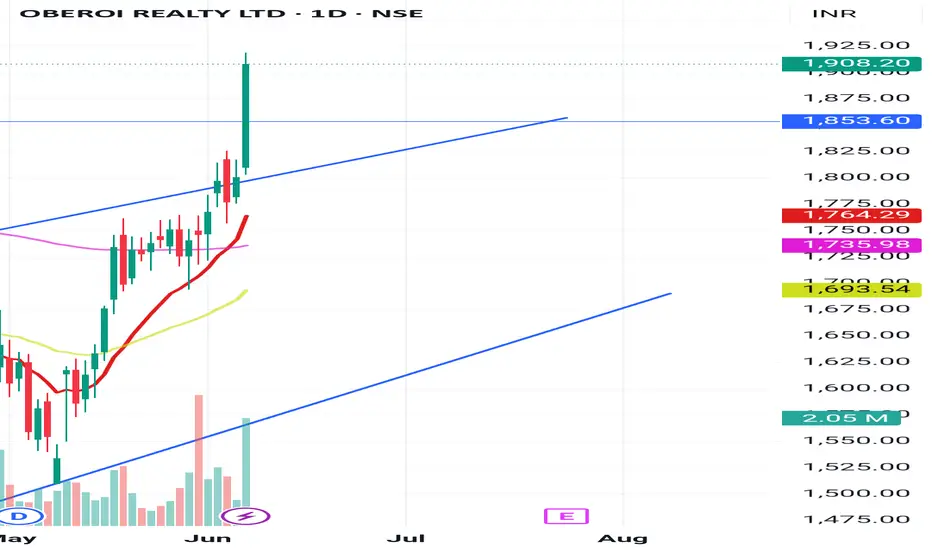
OBEROI REALLY?Entry: Day Close above 1765
SL: Lack of strength below 1765
CNXREALTY - Index also broke out of 0.5 weekly retracement at 961.55.
Fun Fact: OBEROIRLTY goes to IITs for placements. When there are tons of experienced people in the industry with no degree, why pay truckloads to IITians? What's OBEROI

Long call on Oberoi RealtyOberoi Realty Ltd is a real estate development company, headquartered in Mumbai. It is the part of Oberoi Realty Group, focused on developments in the residential, office space, retail, hospitality, and social infrastructure segments.
Price action:
1. Current price : 1908
2. Trading Range : 1460-
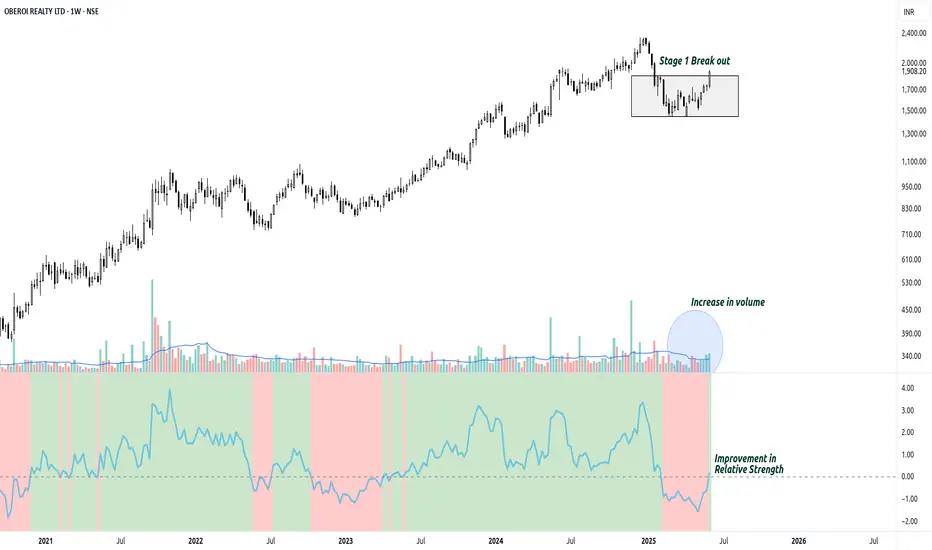
OBEROIRLTYTechnical Analysis
Initiating Stage 1 Breakout with Strong Relative Strength and Volume
The weekly chart for OBEROI REALTY LTD ( NSE:OBEROIRLTY ) presents a highly compelling technical picture, suggesting the stock is on the cusp of a significant uptrend, characterized by a clear Stage 1 breakou
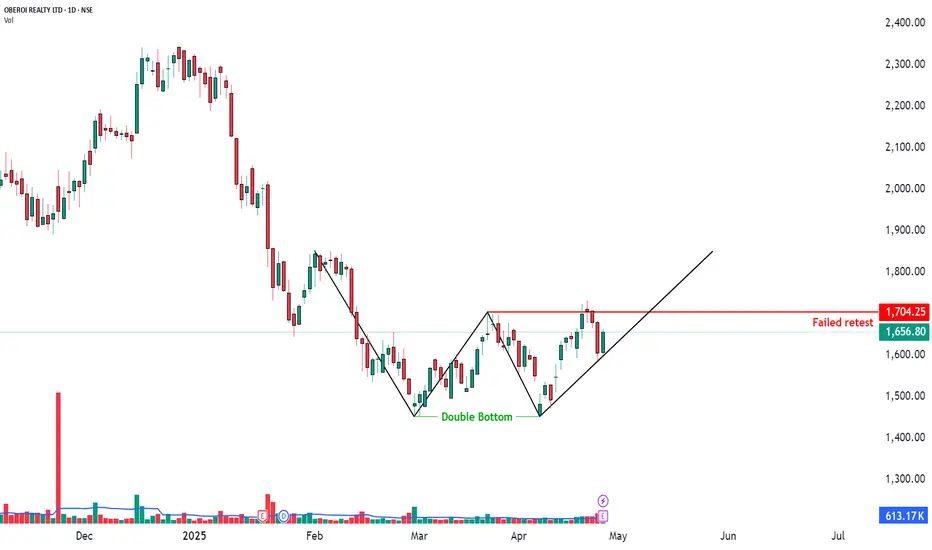
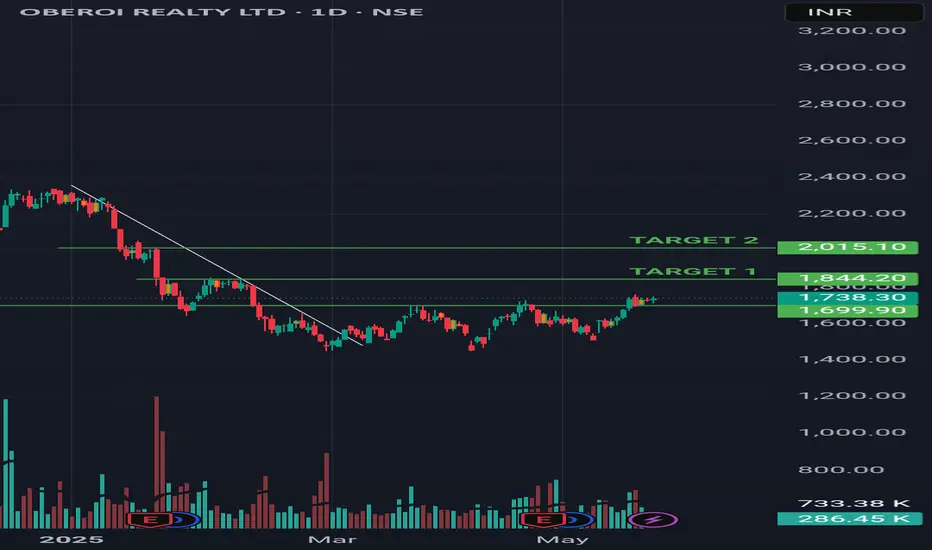
Double Bottom but Failed Breakout Retest | Daily Time Frame📉 OBEROI REALTY LTD – Double Bottom but Failed Breakout Retest
📅 Date: April 28, 2025
📈 Timeframe: Daily Chart
🔍 Stock: Oberoi Realty Ltd (NSE)
📌 Technical Overview:
A Double Bottom pattern was formed indicating bullish reversal potential.
Price attempted a breakout above the neckline near ₹1704.2
Oberoi realtyStock of the week
Oberoi realty
Best stock in the sector is breaking out of consolidation zone with high operating profit margin,this will be block buster in coming days.
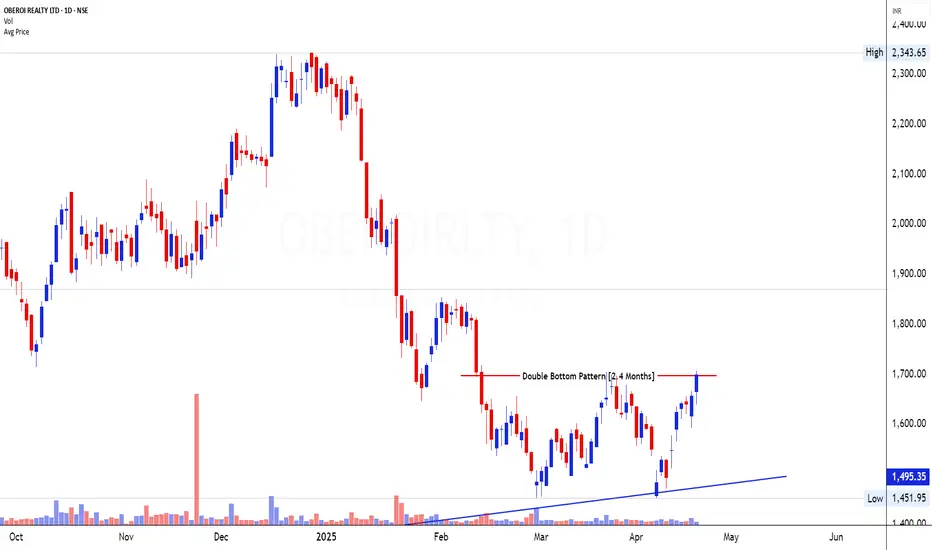
OBEROI REALTY LTD- Double Bottom PatternWeekly chart-
1. Pattern Analysis
OBEROI REALTY LTD has recently formed a Double Bottom Pattern on the daily chart, spanning approximately 2.4 months. This pattern is a classic bullish reversal formation that typically occurs after a prolonged downtrend and signals a potential trend reversal.
OBEROIRLTY Trading Above Weekly Demand ZoneOBEROIRLTY is currently trading at ₹1570, which is above its weekly demand zone range of ₹1546.35 (baseHigh) to ₹1444.4 (baseLow), identified on 17th May 2024. Since the price has moved beyond the demand zone, it suggests that buyers have taken control, potentially signaling strength in the stock. A

Buy Oberoi Realty above 2000 Target 2200 Stoploss 1890Buy Oberoi Realty above 2000 Target 2200 Stoploss 1890
Breakout after 125 Days, Volume on 14th Oct 2024 3.5 times of average volume & Strong fundamintals.
#NSEIndia #BSEIndia #Investing #Oberoirealty

Oberoi Realty - Possible ReversalStock at demand zone
Demand zone 1710 - 1740
Possible reversal from this area
Drop Base Rally seen in daily
Downside safe till 1700 (SL)
Upside target up to 2000
Entry only if strong candle seen in LTF (Hourly)
As market is in bearish mode

See all ideas
Summarizing what the indicators are suggesting.
Neutral
SellBuy
Strong sellStrong buy
Strong sellSellNeutralBuyStrong buy
Neutral
SellBuy
Strong sellStrong buy
Strong sellSellNeutralBuyStrong buy
Neutral
SellBuy
Strong sellStrong buy
Strong sellSellNeutralBuyStrong buy
An aggregate view of professional's ratings.
Neutral
SellBuy
Strong sellStrong buy
Strong sellSellNeutralBuyStrong buy
Neutral
SellBuy
Strong sellStrong buy
Strong sellSellNeutralBuyStrong buy
Neutral
SellBuy
Strong sellStrong buy
Strong sellSellNeutralBuyStrong buy
Displays a symbol's price movements over previous years to identify recurring trends.
795ORL26
Oberoi Realty Limited 7.95% 24-OCT-2026Yield to maturity
—
Maturity date
Oct 24, 2026
805ORL28
Oberoi Realty Limited 8.05% 24-OCT-2028Yield to maturity
—
Maturity date
Oct 24, 2028
8ORL27
Oberoi Realty Limited 8.0% 22-OCT-2027Yield to maturity
—
Maturity date
Oct 22, 2027
See all OBEROIRLTY bonds
EEDM
iShares IV PLC - iShares MSCI EM ESG Enhanced CTB UCITS ETF Unhedged USDWeight
0.12%
Market value
9.75 M
USD
Explore more ETFs
Frequently Asked Questions
The current price of OBEROIRLTY is 1,591.90 INR — it has increased by 1.04% in the past 24 hours. Watch Oberoi Realty Limited stock price performance more closely on the chart.
Depending on the exchange, the stock ticker may vary. For instance, on BSE exchange Oberoi Realty Limited stocks are traded under the ticker OBEROIRLTY.
OBEROIRLTY stock has fallen by −0.42% compared to the previous week, the month change is a −1.19% fall, over the last year Oberoi Realty Limited has showed a −10.65% decrease.
We've gathered analysts' opinions on Oberoi Realty Limited future price: according to them, OBEROIRLTY price has a max estimate of 2,500.00 INR and a min estimate of 1,658.00 INR. Watch OBEROIRLTY chart and read a more detailed Oberoi Realty Limited stock forecast: see what analysts think of Oberoi Realty Limited and suggest that you do with its stocks.
OBEROIRLTY reached its all-time high on Dec 27, 2024 with the price of 2,349.80 INR, and its all-time low was 154.00 INR and was reached on Sep 4, 2013. View more price dynamics on OBEROIRLTY chart.
See other stocks reaching their highest and lowest prices.
See other stocks reaching their highest and lowest prices.
OBEROIRLTY stock is 2.19% volatile and has beta coefficient of 1.39. Track Oberoi Realty Limited stock price on the chart and check out the list of the most volatile stocks — is Oberoi Realty Limited there?
Today Oberoi Realty Limited has the market capitalization of 572.84 B, it has increased by 2.50% over the last week.
Yes, you can track Oberoi Realty Limited financials in yearly and quarterly reports right on TradingView.
Oberoi Realty Limited is going to release the next earnings report on Oct 15, 2025. Keep track of upcoming events with our Earnings Calendar.
OBEROIRLTY earnings for the last quarter are 11.60 INR per share, whereas the estimation was 19.54 INR resulting in a −40.63% surprise. The estimated earnings for the next quarter are 16.11 INR per share. See more details about Oberoi Realty Limited earnings.
Oberoi Realty Limited revenue for the last quarter amounts to 9.88 B INR, despite the estimated figure of 15.53 B INR. In the next quarter, revenue is expected to reach 14.45 B INR.
OBEROIRLTY net income for the last quarter is 4.21 B INR, while the quarter before that showed 4.33 B INR of net income which accounts for −2.75% change. Track more Oberoi Realty Limited financial stats to get the full picture.
Oberoi Realty Limited dividend yield was 0.49% in 2024, and payout ratio reached 13.07%. The year before the numbers were 0.54% and 15.10% correspondingly. See high-dividend stocks and find more opportunities for your portfolio.
As of Oct 10, 2025, the company has 1.48 K employees. See our rating of the largest employees — is Oberoi Realty Limited on this list?
EBITDA measures a company's operating performance, its growth signifies an improvement in the efficiency of a company. Oberoi Realty Limited EBITDA is 30.46 B INR, and current EBITDA margin is 60.30%. See more stats in Oberoi Realty Limited financial statements.
Like other stocks, OBEROIRLTY shares are traded on stock exchanges, e.g. Nasdaq, Nyse, Euronext, and the easiest way to buy them is through an online stock broker. To do this, you need to open an account and follow a broker's procedures, then start trading. You can trade Oberoi Realty Limited stock right from TradingView charts — choose your broker and connect to your account.
Investing in stocks requires a comprehensive research: you should carefully study all the available data, e.g. company's financials, related news, and its technical analysis. So Oberoi Realty Limited technincal analysis shows the strong sell today, and its 1 week rating is sell. Since market conditions are prone to changes, it's worth looking a bit further into the future — according to the 1 month rating Oberoi Realty Limited stock shows the neutral signal. See more of Oberoi Realty Limited technicals for a more comprehensive analysis.
If you're still not sure, try looking for inspiration in our curated watchlists.
If you're still not sure, try looking for inspiration in our curated watchlists.