PIDILITIND trade ideas


#pidilite Bearish Crab @in_tradingviewNSE:PIDILITIND
Pidilite Bearish Crab
Short Zone 1378 - 1385
SL 1405
T 1358 1345 1327


Investment idea.1- Beautiful rang break out .
2- Company is virtually debt free.
3- Company has a good return on equity (ROE)
Tack record: 3 Years ROE 26.42%
4- Company has been maintaining a healthy
dividend payout of 31.89%

This fevicol is strong!!Stock given fresh breakout and good to enter at 1310 or above for the targets 1375/1400. SL 1285

PIDILITE - SHORT OPPORTUNITYPidilite going towards Weekly Trendline. Possible reversal from Weekly trendline.
Targets are shown in Chart
Targets Shown in Chart can be achieved by 3rd week of Sept.

pidilitebearish butterfly pidilite
sell 1394 to 1396 sl 1305.8
tgt 1383 ,1375 ,1369 ,1360 cmp 1659.75

pidilitePidilite long if it closes above 1372
it can retrace to 1300 level also one can go long after the bounce from 1300 level


PIDILITE ShortWISHING EVERYONE HAPPY INDEPENDENCE DAY
Please have a look at the chart, Sl and Trg will be updated if prediction works, plan your trade accordingly.
Regards,
Sharma Yogesh

PIDILITE IND SHORTNSE:PIDILITIND
Only for education and information purpose. Should not be taken as a trading call
IT LOOKS LIKE A SHORT CAN BE TAKEN AT D POINT LETS C HOW IT WORKS
CHART BY HARMONIC LEARNING AND EARNING

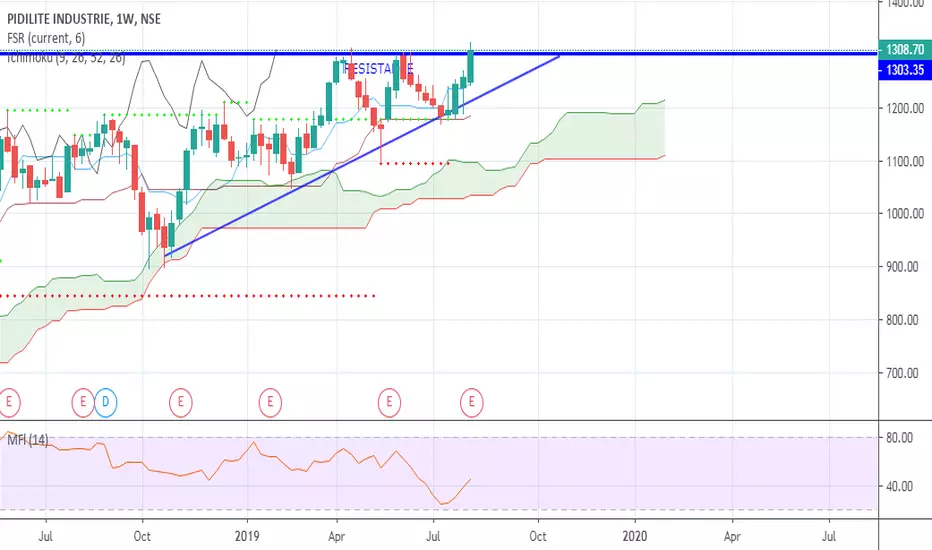
Pidilite Long06 Aug 2019: Good results from Pidilite. Better than expectations. Can see the stock going up as ascending triangle pattern forms. If the next candle closes above 1310 then huge upside can be seen in the stock. CMP 1308.70. T1- 1330, T2-1360, T3 - 1400; SL - 1278.


PIDILITE INDS - GOOD PERFORMANCEPIDILITE INDS SUCCESSFULLY CLOSED ABOVE THE 1300 LEVEL (PLS SEE MY POST ON 03RD AUG).
NEXT LEVELS SHOULD BE NEAR 1375 LEVEL.
AS THE Q1 FIGURES ARE GOOD-
Net Sales at Rs 2,016.81 crore in June 2019 up 9.96% from Rs. 1,834.07 crore in June 2018.
Quarterly Net Profit at Rs. 292.89 crore in June 2019 up 22.72% from Rs. 238.67 crore in June 2018.
THE ABOVE 1375 WAS CALCULATED. ALL TIME HIGH IS 1400.
intraday and short-term swing callintraday and short-term swing call NSE:PIDILITIND
* VALID ONLY 2 DAY NOT TRIGGERED ENTRY PRICE IGNORE THIS CALL
Entry - Long side
ENTRY PRICE - 1270.40
SL - 1185.50
T1 - 1276.80 (FOR INTRADAY)
T2 - 1283.10 (FOR INTRADAY)
T3 - 1355.40 (FOR SWING 5 TO 10 DAYS)


PIDILITE (Pidilite Industries Limited) BUY ABOVE 1280PIDILITE (Pidilite Industries Limited) BUY ABOVE 1280

BULLS RIDING IT We can enter @ CMP or if there is a pull back for 1244 which mostly likely will not happen looking at price action. First target 1295 after that could be 1350+. If you want to go for long for few weeks enter above 1295.

PIDILITE INDSLOOKING AT THE DAY CHART, ALL THE FACTORS ARE INDICATING BULLISHNESS IN THIS COUNTER.
1300 IS THE TARGET WHICH SEEMS CAN BE ACHIEVED.
ALSO, THE TRADED VOLUMES WITH INCREASE IN PRICE SUPPORTS THIS.
KEEP THE LOWER TREND LINE AS STOP LOSS OR AT 1210.
