Praj Industries All detail for chat. good entry at mark price only. and must stoploss is 335 minimum risk and good profit. risk ratio 1:1 in first target. This is not call my idea only. Please understand your risk and take full responsibility of your actions
PRAJIND trade ideas

breakout stocks for tomorrow on 25th July 2022as predicted market entered into bearish tread, it will consolidate for comple of days
I gave 3 break out stock for tomorrow

Swing trade in Praj industriesPraj industries looking good for further advancement. VCP pattern can be seen. On weekly there is indise bar. Low risk entry point found


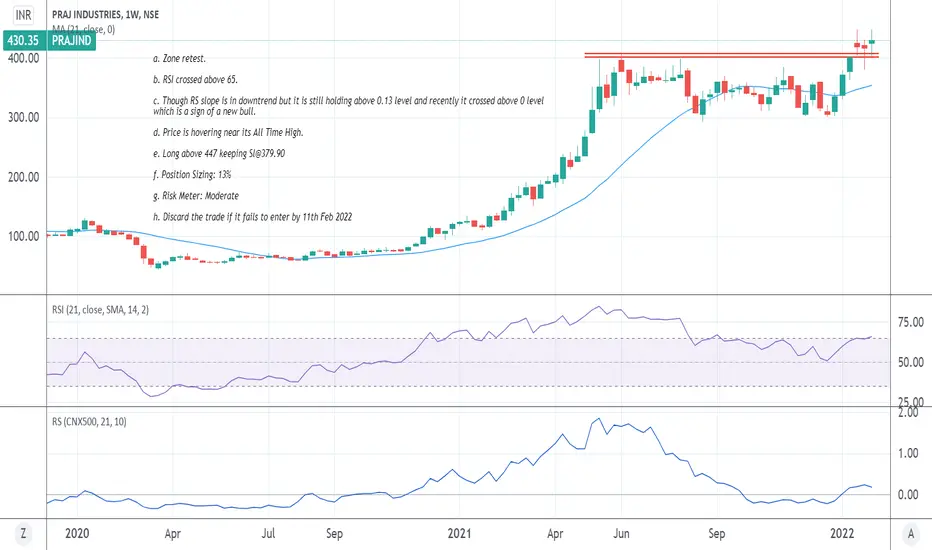
PRAJINDNSE:PRAJIND
One can Go long ! or wait for Retracement from the trendline !
Looking good on weekly as well.
SL can be Below trendline or Swing Low, what ever favours one.

long term holding target 645good stock to hold for year
stock has good potential to perform
buy and hold for more then a year

Praj ready for next breakout#praj
Praj industry looks getting ready for Inv HS BO.
Will take pilot position on Day close above 430
And final position on DC > 445
#vr

Praj Industries viewPraj Industries :
Parallel Channel & Ascending Triangle Breakout possibility
Might show new 52 week high soon


PRAJIND: Stock can see 600+ levels soon! 1. Stock has been consolidating for over year now.
2. Did attempt channel break out but failed. Attempted it again.
3. 448 is the spot where stock faced resistance (ATH) and fell twice from same levels.
4. Stock may again attempt to break 448 and sustain above it. 450 being a round number sounds better trigger to enter.
5. Weekly closing above 450 can lead stock to 600+ levels in coming weeks. Keep in watchlist.
6. Consult your financial adviser before investing. If worth it, do Like, Share and Comment.

PRAJ industries, Flag & Pole Breakout candidate on Monthly chartPraj Inds has formed a probable Flag & Pole BO formation on monthly chart. RSI is well above 60, volumes has been good, After a long consolidation looks set for a good movement.
Discl : Invested, Chart for education purpose only, this is not a reco for buy & sell.

PRAJIND Kumo BreakoutPerfect Example of Kumo Breakout. Checkout the price behaviour in coming days.
#This is not Buy and Sell recommendation to any one. This is for education purpose and a helping hand to learn trading in Market.
# Rule Based Investing
# Ichimoku Cloud
# Ichimoku Followers
I hope you all like my analysis. Please do share your thoughts into comment section of Trading View.
Please give a like, it motivates me to do analysis and do share our channel with your friends as well.

#Inverted H&S pattern?#Praj_Ind
Bullish Setup
380-385 is an important zone.
If we get a daily close above 385, we can enter long with a stop loss of 360(previous swing low) and a target of 440-450
Disclaimer- Educational View


Praj industries long Praj Industries, weakly time frame it's a good multi months breakout.
Fundamentally strong company which is having great admiration for ethanol production. You can consider this for a long-term idea 💡.

Flag Pattern (Flag and Pole Pattern)A flag pattern is a trend continuation pattern, appropriately named after it’s visual similarity to a flag on a flagpole. Flag patterns can be bullish or bearish.
1. Flagpole: A line extending up from this break to the high of the flag/pennant forms the flagpole. The flagpole is the distance from the first resistance or support break to the high or low of the flag. The sharp advance (or decline) that forms the flagpole should break a trend line or resistance/support level.
2. Flag: A flag is a small rectangle pattern that slopes against the previous trend. If the previous move was up, then the flag would slope down. If the move was down, then the flag would slope up. The price action just needs to be contained within two parallel trend lines.
3. Break: For a bullish flag, a break above resistance signals that the previous advance has resumed. For a bearish flag, a break below support signals that the previous decline has resumed.
4. Volume: Volume should be heavy during the advance or decline that forms the flagpole. Volume contracts during the flag's formation and expands right after the resistance/support breakout.
5. Target: The length of the flagpole can be applied to the resistance break or support break of the flag to estimate the advance or decline.


prajpraj swing trade possibilities. 2nd in a list of the world’s 50 Hottest companies in the global bio-economy for 2021 in the Low Carbon

Praj ind weekly chart Pole and flag pattern breakout , good support around 350-360 , can be budget top pik

Praj Ind: False or Real BreakoutClosing below shaded region on weekly chart will make it false breakout, if bulls able to defend this then highly bullish on this counter.

magic of wavesPRAJ IND looks good taking support on demand zone and forming 3w after taking 38.20 % support

Praj industries - Breakout and Retest Breakout and re-test in Praj Industries
It should take support on the previous breakout trendline and revert
Wait for reversal candle . . .
Disclaimer: Pls invest at your own risk.
