Rallis India -Double BottomRallis India :
Nice Double Bottom Breakout
Sustaining 280 levels may show 300, 320
RALLIS trade ideas

Rallis india (correction) It's look like a uptrend correction. Let's wait for 2 to 3 weeks to see the breakout.

Rallis rally has just begunRallis rally has just begun
Above 280 can speed up to 300 very quickly
High volumes and a breakout
Stay ready

Channel Breakout with VolumeRallis India at a price of 280 has broken the channel supported with strong volume.
Target: 300--325--360
Stop Loss: 255-260
#TradeTheTrend#TechnicalPick

Descending channel breakout in RALLISChart -> Rallis India Daily
We can see descending channel breakout.
CMP: 278
Target: 295, 324, 362
SL: 255
Disclaimer: This is for educational purpose only. This is not any recommendations. I am not SEBI registered. Please consult your financial advisor before taking any action.

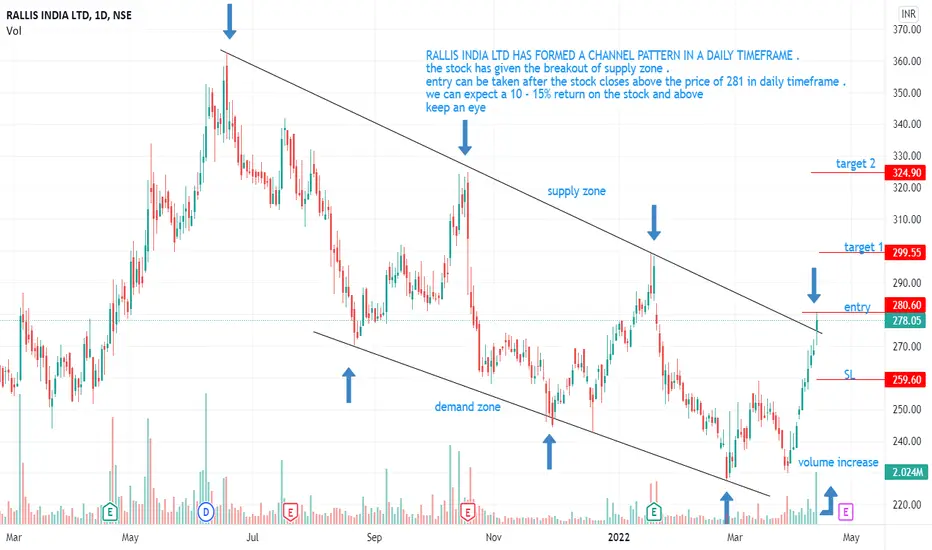
PARALLEL CHANNEL BREAKOUT RALLIS INDIA LTD HAS FORMED A CHANNEL PATTERN IN A DAILY TIMEFRAME .
the stock has given the breakout of supply zone .
entry can be taken after the stock closes above the price of 281 in daily timeframe .
we can expect a 10 - 15% return on the stock and above
keep an eye
********** PLS FOLLOW RISK MANAGEMENT *************************************
Rallis India : W patternRallis India : Keep eyes on it
On the verge of W pattern Breakout after a visible Double bottom on charts.
Volumes Building up & stock has good Strength.

RALLIS Breaking out again after a retest. Also formed a Bullish Butterfly harmonic pattern with a ABCD Ext.
Targets 325, 360

RALLIS INDIA - Trendline & RectangleTrendline and Rectangle breakout on the Daily Chart of RALLIS INDIA. BUY 278 -> 300, 310, 325, 335, 350 : SL/Support - 268, 258, 250, 244.

Positional or Longterm Opportunity in RallisGo Long above 269.4 for Targets of 296.45 and 323.5 with SL 242.35
Reasons to go Long :
1. On a Monthly timeframe if we draw the Fibonacci retracement tool from recent swing low (point A) to recent swing high (point B) then we see stock took support from 0.5 Fibonacci level.
2. Also a bullish candlestick pattern Bullish Engulfing (marked with orange color) is formed around 0.5 Fibonacci level.
3. In addition to this there is a strong demand zone (marked with purple color), from which the stock initially faced resistance but now is taking support and moving up.
4. There is a trendline (marked with red color), which is providing resistance to the stock so we have placed our final target just below it.

daily chart of rallis Indiadaily chart of rallis India
educational purpose only
looks like a double bottom plus the downtrend was broken
CMP: 274.00
SL below 267.05

Rallis India Ltd is near strong support zoneThe Rallis India ltd price has been touch lower circuit level of 52 week low. To take the long positions to hold.

RALLIS INDIA Daily chart pattern analysis 13.12.2021RALLIS INDIA posted earlier after forming an ascending triangle Above 262 Level for a Target 267 and Today the stock made a HIGH 269 due to a strong RESISTANCE 270 Level. HAPPY TRADING TO ALL

RALLIS INDIA Daily chart pattern analysis 09.12.2021RALLIS INDIA as per daily chart analysis has formed an ascending triangle pattern and once the stock breaks 260 level then above 262 for a target 267 level.

RALLIS INDIA Daily chart pattern analysis 08.12.2021RALLIS INDIA as per daily chart pattern analysis after a brief consolidation is about to break 260 level and resistance is at 270 level. Once the stock breaks 270 level then uptrend momentum will begin for target 315 level.

RALLIS INDIA Daily chart pattern analysis 01.12.2021RALLIS INDIA as per daily chart pattern analysis iam very surprised to find the stock has not shown any sign of recovery after hitting the support levels and once it breaks 243 level then next support level is at 238 and next is placed at 232 level. I hope tomorrow being bullish the stock should reverse from here and consolidate to move upwards.

RALLIS chart pattern analysis 26.11.2021RALLIS INDIA as per daily chart pattern analysis has taken the trendline support and if it breaks then 255 is the next support level followed by 243 support level for the stock to reverse. However one can see a fresh buying opportunity only after full correction completed.

RALLIS chart pattern analysis 25.11.2021Rallis has beginned to move in the uptrend channel with a W pattern formation and from target 275 level. Holding the stock. Happy trading to all

Rallisgood parallel channel last 19 yrs.
if it is able to save the marked zone then we may see upside. may be slow as of now

Rallis India LimitedBullish divergence between price and RSI indicator in Rallis India Limited. also there is bullish MACD crossover

RALLIS INDIA LTDIt is in Wolfe Wave structure it is expected to generate upside reversal. The targets will be updated later. The SL stands to be at 255 on closing basis.
CHART & ANALYSIS BY - ADARSH DEY

Diwali Pick! - a TATA Group company (Upside 30-60%), Time - 1YrJust for Study purposes, Personally Invested!
I have marked the multi-year Supports with Red Circles, since 2010.
Take decisions based on personal conviction.
I personally find an upside of 30% in a year & 60% ultimately in a period of 1.5-2yrs. (Being a TATA company, Downside risk from here is in control)
~Happy Mahurat Buy~

Positional Opportunity in RallisGo Long above 302.1 for Targets of 323.2, 344.3, and 365.4 with SL 281
Reasons to go Long :
1. On a daily timeframe if we draw the Fibonacci retracement tool from recent swing low (point A) to recent swing high (point B) then we see stock took support from 0.618 Fibonacci level.
2. A bullish chart pattern, Double Bottom (W pattern) is formed around 0.618 Fibonacci level.
3. Also there is a strong demand zone (marked with purple color), from which the stock initially faced resistance but now is taking support and moving up.
4. In addition to this the stock is forming an ascending channel pattern.
