Trade ideas
RATNAMANIMetal stocks are in bullish. this tube & metal stock is going to start it's second phase of run after resting a long time. all moving averages are compressed and price action is showing buy signal. targets are marked on chart.

Stocks To WatchWe have attached the chart here for highly potential upward rally stock People and smart money showing their interest in the stock and as a result we have noticed high delivery of QTY In recent days but still do not buy until it break the trendline resistance as well as immediate horizontal resistance.
Disclaimer - Education Purposes only, Make your own Research before Any actions you take.

Positional or Longterm opportunity in RatnamaniGo Long @ 2915.1 for Targets of 3110.2, 3305.3, and 3500.4 with SL 2720
Reasons to go Long :
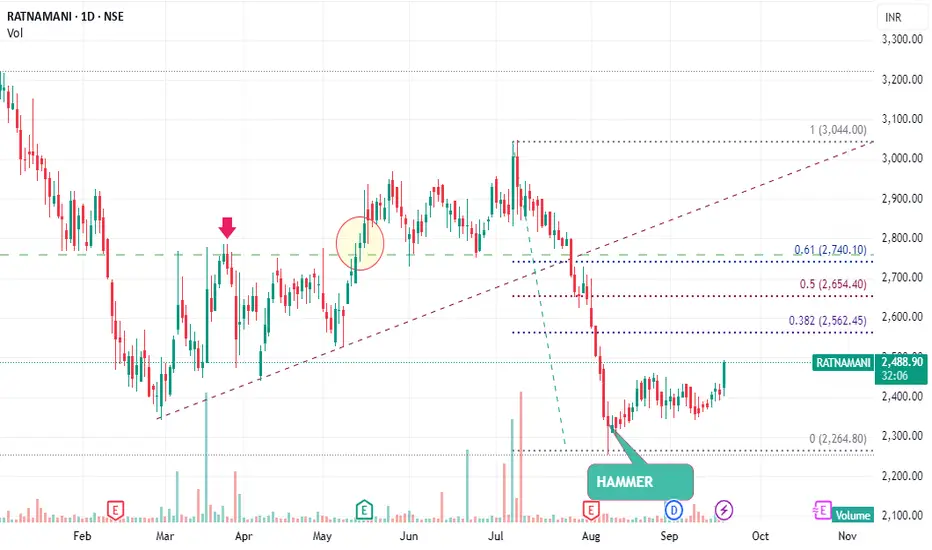
1. On a Weekly timeframe if we draw the Fibonacci retracement tool from the recent swing low (point A) to the recent swing high (point B) then we see stock took support from the 0.382 Fibonacci level.
2. In addition to this a bullish candlestick pattern Bullish Harami (marked with orange color) is formed around the 0.382 Fibonacci level.
3. Also there is a strong Trendline (marked with green color), from which the stock is taking support and moving up.

Breakout in Ratnamani Metals and Tubes Ltd...Chart is self explanatory. Levels of breakout, possible up-moves (where stock may find resistances) and support (close below which, setup will be invalidated) are clearly defined.
Disclaimer: This is for demonstration and educational purpose only. This is not buying or selling recommendations. I am not SEBI registered. Please consult your financial advisor before taking any trade.

Ratnamani Metals and Tubes Ltd - Long Setup, Move is ON...#RATNAMANI trading above Resistance of 3167
Next Resistance is at 4803
Support is at 2131
Here is previous chart:
Chart is self explanatory. Levels of breakout, possible up-moves (where stock may find resistances) and support (close below which, setup will be invalidated) are clearly defined.
Disclaimer: This is for demonstration and educational purpose only. This is not buying or selling recommendations. I am not SEBI registered. Please consult your financial advisor before taking any trade.

#RATNAMANI #NSE - BULLISH FLAG PATTERNRATNAMANI METALS AND TUBES LTD
Bullish Flag Pattern in a 60 min time frame.
Positive quarterly results.
Ratnamani Metals & Tubes Ltd.'s Revenue was higher than average estimate 2 times in past 3
EPS is expected to grow by 17.7% in FY24.
FII/FPI have increased holdings from 12.79% to 12.87% in Sep 2023 qtr.
Disclaimer:
For educational purpose only.
Please do your own research before taking any trades.
Happy Trading!

Catch it if u can.........Chart is self explanatory
Already broken out with huge volume candle
Volume on chart shows demand
Already high in sky meaning no supply or resistance zone above
Don't just blind buy..... This ain't no tip......Buy at ur own risk
Comment down below ur views and lemme know what u think abt my review.

Trade-3/100-RATNAM-R:R Experiment-Buy3rd trade in the series
Buying RATNAMANI in hourly POSITIONAL trade

#Ratnamanimetals cash : Looks good above 1930.10#Ratnamani metals -Positional call
29.08.2022
Stock is in uptrend and given a nice Ascending traingle breakout. chart shows the rising channel as price making higher lows and making continues resistance and closed above the resistance zone.
If high is crossed with volumes it will be sign of superbreakout.
Buy above 1930.10
Stoploss 1820
Target 2140/2400
Cmp 1887.65

Ratnamani Metals ---------- According to chart Pattern the stock should reverse from here?
Otherwise downside target is 1700.

Ratnamani ViewRatnamani :
Facing Stiff Resistance, might breakout Strong
Long above 2650 with SL 2600

Ratnamani - Breakout Ratnamani :
Good Breakout
Sustaining 2525 might take it to new 52 week high 2650 soon

RATNAMANI METALS TGT 3000 COMING SOONRatnamani Metals tgt 3000 soon....
.382 2185/-
.5 2543/-
.618 2703/-

RATNAMANICMP: 2288
- Low volume stock
- Trading near All Time High region (2335)
- FIIs & DIIs have increased their stake in the last few quarters
- QoQ Increasing sales

RatnaMani Met & TBS is ready to give you big ProfitssRatnaMani Met & TBS is showing a weekly Triangle Breakout, and this stock can move real soon.
The 1st Redline is the 1st Target as well as the Resistance line. The next red line is the 2nd Target. The stock has the power to go up more, so keep the trailing stop loss on. Trade on your own risk management and trade management tool
As the market is showing no clear direction, be cautious for not just this trade, but with every trade

Sell below 1893 SL 1902 TGT 1883 and 1872Suggestions are based on my analysis only. Please do your analysis before taking any trade.

Ratnamani Metals & Tubes Ltd (EDUCATIONAL PURPOSE ONLY)Nothing guaranteed and Nothing over week
Invest or trade according to your loss bearing capacity
STOCK FOR EDUCATIONAL PURPOSE ONLY
Ratnamani Metals & Tubes Ltd. @ 2205 with target of 2250 CMP IS 2182.25.
STOP LOSS: ACCORDING TO YOUR RISK APPETITE OR @ 2150.
Disclaimer: I am not Sebi Registered. All my ideas/opinions and analysis is for your information and educational purposes only and it does not constitute any recommendation to buy or sell any stock or index. Use your own wisdom.
M B PANDEY
SHARE MARKET ANALYST
B.Sc. (MATHS & PHYSICS)
Trying to spread happiness and knowledge
Disclaimer: I AM NOT SEBI REGISTERED

RATNAMANI LOOKS GOOD PRE OPENING PICK 29-09-21BUY 2220-2230 T1 2260 T2 2300 SL 2170 -DKM SIR
buy and hold as per your risk
i think it break its previous high and make new 52 week high ..

Intraday and Swing Trade: watch for resistance breakoutbuy above 2250 for Swing and Intraday
for Swing keep Stoploss below Trendline
If you want to take risk than can buy above 2220 in intraday though safe level is 2250.
For stoploss in Intraday use 5 minute chart and see nearest support.
for target use 5 min chart and fibonacci pivots as i don't keep predefined target.
try to book partially and trail.
Note: this is not a prediction for LONG/SHORT, trade will trigger only on given level as per technical analysis
NOTE: For Gapup or bo before 9:20
If gapup is more than 1% from bo level than avoid completely.
if less than 1% or gives bo before 9:20 than wait for
first 5 minute candle and entry above 5 minute candle
and revised SL below candle Low.

WATCHOUT RATNMANI TRENDLINE BREAKOUT BUY 2213-2222 T1 2284 T2 2320 SL2105 -DKM SIR
i think it break the trendline in monday morning and make its 52 week new high buy and hold as per your risk
THANK U ALL OF U .. 20/09/21

Bullish coninuation------------------------------------------------------------------------------------------------------------------------------------------------------

RATNAMANI - Price and Trend SetupStocking consolidating from long and may give breakout soon as price will squeeze in narrow range. With Metal booming stock may run much higher.
