SBILIFE trade ideas
SBI LIFE (BUY AND SELL)Why Buy and Sell
Now you need to understand the chart Is creating 2 patterns at the same time
1. Tripple Top (which is a trend reversal)(Which is highlighted in Yellow)
2. Cup and handle (which is highlighted in Blue)
If the price crosses the resistance line and creates a new candle above the resistance line then Buy the Target is 1130.( Which means its completing Cup and Handle Pattern)
If the price crosses the Support line and creates a new candle Below the Support line then Sell the Target is 860, 778, 737.( Which means its completing Tripple Top Pattern)
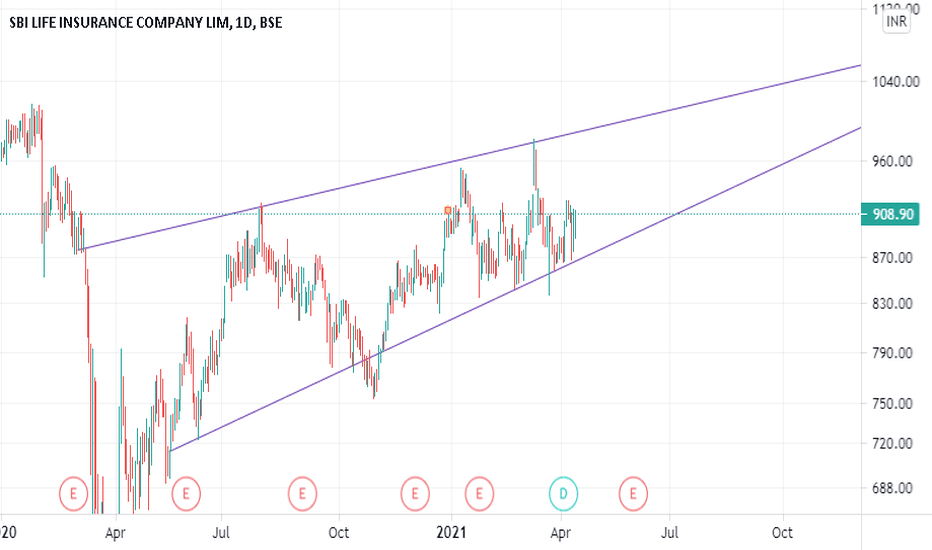
Multi Year Breakout - with Ascending Triangle Pattern SBI Life Insurance is involved in the business activities of Life insurance.
The Stock is ready to break out a multi year resistance placed around 1020 levels. The Stock is technically placed at 10% above its 50 DMA. The RSI Levels are around 69 which is still not overbought.
The Company is fundamentally strong backed by SBI. Further, the company belongs to Life Insurance Sector which has a huge potential in coming years. An annual revenue growth of 28% is outstanding & ROE of 16% is good. The Company is Debt Free. FPI has increased their stake from 26.15% in June, 2020 to 30.51% in March 2021.
Watch out for breakout above 1020 levels. For Swing & Positional Traders, add only after close above 1040 for targets of 1200-1300 with SL at 970. Long Term Investors can keep accumulating with SL at 900 for Targets of 1500-1600
Feel Free to share your Feedback and Queries.
SBI Life Insurance - Ascending Triangle Breakout on WEEKLY chartSBI Life Insurance Company Ltd. Was in a consolidation for last 9 months since 27th July 2020. This consolidation is characterised by the rising resistance line as well as rising support line. Price gave the upward breakout to the consolidation on the weekly candle (Week 3rd May-7th May) and closed at Rs.1,000.25 with massive volume support. I anticipate the price target of Rs.1,145 and suggest the stop loss at Rs.959 to be followed for the first four weekly candles after the breakout candle. Thereafter, the profit booking/ exit decision should be based on the achievement of the price target or downward crossover of 26 EMA by 5 EMA. The price target is expected to be achieved in 5 months after the current breakout candle.
NOTE: This idea is an attempt to predict the future price movement. Investment decision based on this idea, if any, shall be at the sole risk of the investor.
SBI LIFE (NSE CASH)SBILIFE (NSE CASH)
CHART ANALYSIS
LTP: 1000.25
SUPPORT: 983.45
RESISTANCE: 1031.25
DATA
IMPORTANT LEVELS WITH OPEN INTEREST
980pe: 237000 (2nd SUPPORT / STOP LOSS LEVEL)
1000ce: 714000 (STRONG SUPPORT)
1020ce: 452250 (1st TARGET)
1050ce: 481500 (2nd TARGET)
***BUY CALL RETAINED WITH NEW TARGETS.
MARKET CAP: 506.254B (ABOVE 200B / VERY GOOD)
VOL: 3.16M (ABOVE 500K / VERY GOOD)
REL VOL: 2.05 (ABOVE 2 / GOOD)
AVG VOL: 7.665M (ABOVE 100K / VERY GOOD)
FLOAT: 459.5M (BELOW 2B / VERY GOOD)


