How to Backtest, Create a Strategy and Execute a Trade In this video I have showed a good trade is executed with proper planning and mindset .
Charts Used in this video are older than 3 months . Only for educational content .
TATAINVEST trade ideas

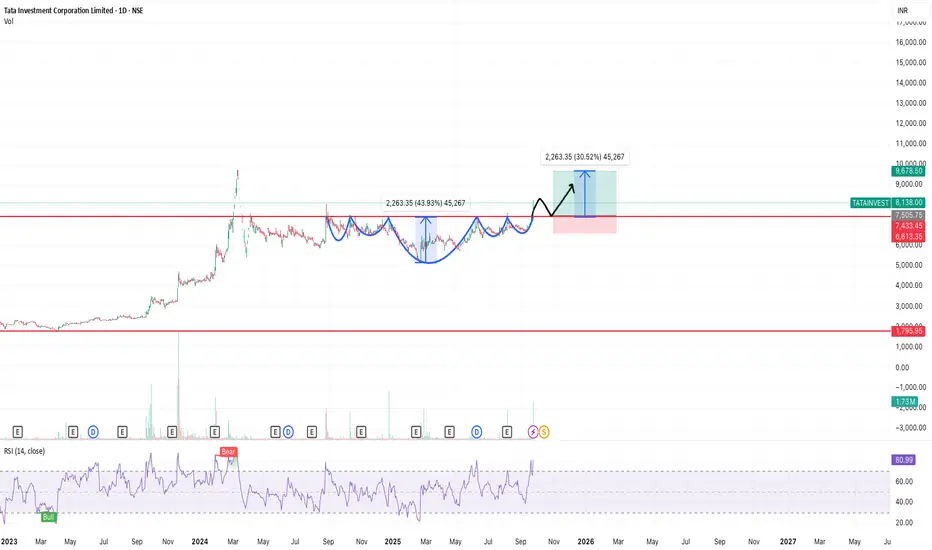
Tata Investment Corporation : Inverted Head & Shoulder(breakout)Tata Investment Corporation is forming a inverted head and Shoulder pattern right shoulder . On Friday last week , the stock is just around the neckline .
The Stock just gave breakout on daily, weekly and monthly candles and can be bought on retest
RSI daily reading is above 70 indicating a positive momentum.
Stop loss: 6600
Target: 9600
This is for learning purpose, please DYOR
TATA investment Time To Take Charge For Long Position **Tata Investment Corporation Ltd – Detailed Business Model**
---
## Company Overview
* **Name:** Tata Investment Corporation Ltd (TICL)
* **Founded:** 1937
* **Headquarters:** Mumbai, India
* **Ownership:** Promoted by Tata Sons; part of the Tata Group
* **Type:** Non-banking financial company (NBFC) registered with the RBI
---
## Business Nature
Tata Investment Corporation is primarily an investment company. Its core business is the **long-term investment in listed and unlisted equity shares, debt instruments, and mutual funds**.
The company does not participate in trading or speculative investments. Its revenue model is **built on dividends, interest income, and capital appreciation** from its portfolio holdings.
---
## Key Revenue Sources
1. **Dividend Income** – from equity holdings in Tata Group companies and other firms
2. **Interest Income** – from debt securities, fixed deposits, and bonds
3. **Capital Gains** – realized through sale of investments
---
## Investment Philosophy
* Long-term investor focused on value and growth
* Conservative and diversified portfolio strategy
* Emphasis on **blue-chip companies**, especially Tata Group firms
---
## Business Model Canvas
| Key Partners | Key Activities | Value Proposition |
| ---------------------- | ------------------------------------ | --------------------------------------------------- |
| Tata Group Companies | Investment Research & Portfolio Mgmt | Stable and long-term capital appreciation |
| Financial Institutions | Risk Management | Exposure to India's leading businesses |
| Brokers & Custodians | Dividend and Interest Collection | Low-risk investment profile with consistent returns |
| Customer Relationships | Customer Segments | Channels |
| ---------------------- | ---------------------------------- | -------------------------------------------------- |
| Investor Reports, AGMs | Retail and Institutional Investors | Stock Exchanges, Annual Reports, Corporate Website |
---
## Portfolio Composition
* Majority investments in:
* Tata Consultancy Services (TCS)
* Tata Steel
* Titan Company
* Tata Motors
* Other Tata Group firms
* Sector diversification: IT, auto, power, steel, finance, FMCG
---
## SWOT Analysis
**Strengths:**
* Strong brand equity as part of Tata Group
* Stable and predictable income via dividends
* Conservative investment approach
**Weaknesses:**
* Passive business model
* Limited growth levers beyond capital markets
**Opportunities:**
* Capital market expansion in India
* Diversification into ESG and digital businesses
**Threats:**
* Market volatility
* Regulatory risks in NBFC and investment sectors
---
## Risk Management
* Invests in high-quality, low-volatility assets
* Maintains high liquidity in portfolio
* Avoids speculative trading
---
## Financial Highlights (FY2023-24)\*
* **Revenue:** ₹409.75 crore
* **Net Profit:** ₹354.67 crore
* **Market Cap:** ₹17,000+ crore (approx.)
* **Dividend Yield:** \~1.3%
(\*Approximate values; refer to latest filings for updated numbers)
---
## Conclusion
Tata Investment Corporation Ltd functions as a **holding and investment company** that capitalizes on the strengths of the Tata ecosystem. With a stable and conservative approach to investing, it remains a **low-risk, dividend-generating option** for long-term investors seeking exposure to blue-chip Indian equities.
Thanks & Regards
Mohinder Singh
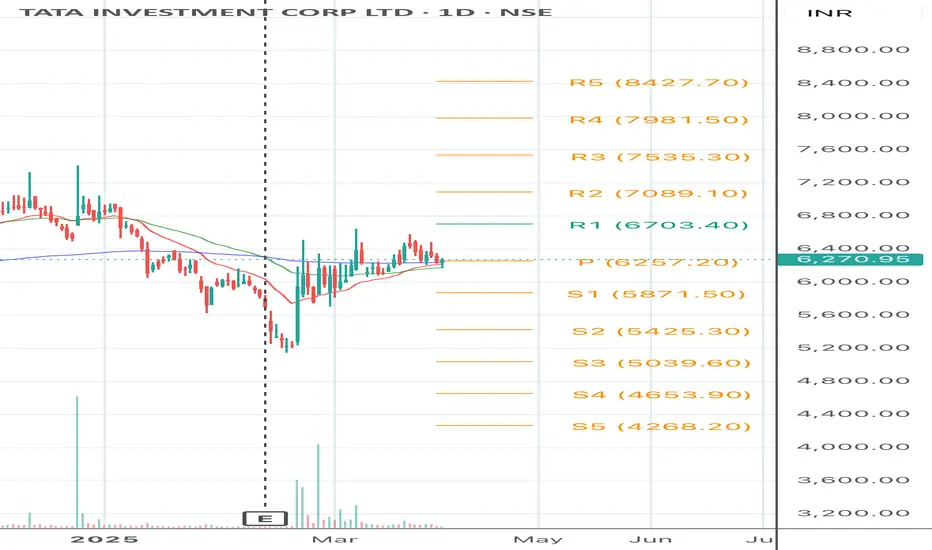
TATA INVESTMENT CORP LTDAs of May 26, 2025, Tata Investment Corporation Ltd. (NSE: TATAINVEST) closed at ₹6,269.00. Here's an overview of its 15-minute intraday support and resistance levels based on technical analysis:
📊 15-Minute Intraday Support & Resistance Levels
While specific 15-minute pivot points are not readily available, we can refer to the daily pivot levels as a proxy for intraday analysis:
Classic Pivot Points:
Pivot Point (P): ₹6,257.33
Resistance Levels:
R1: ₹6,374.66
R2: ₹6,480.33
R3: ₹6,597.66
Support Levels:
S1: ₹6,151.66
S2: ₹6,034.33
S3: ₹5,928.66
These levels can serve as reference points for intraday trading decisions.
🔍 Technical Indicators Overview
RSI (14-day): 57.56 — indicating neutral momentum.
MACD: 27.09 — suggesting bullish momentum.
Stochastic Oscillator: 72.08 — approaching overbought territory.
Supertrend Support: ₹5,861.93 — acting as a dynamic support level.
Parabolic SAR: ₹5,842.13 — indicating an upward trend.
These indicators suggest a cautiously bullish outlook for the short term.
📈 Trading Strategy Insights
Bullish Scenario: A breakout above ₹6,374.66 (R1) with strong volume could signal further upward momentum.
Bearish Scenario: A drop below ₹6,151.66 (S1) may indicate potential downside risk.
Traders should monitor these levels closely and consider additional technical indicators for confirmation.
Tata investment seems to be in a positional setupTata investment seems to be in a positional setup for medium to long term.
Note: This is not a trade recommendation. Markets are still falling and Tariffs news this week may still take most stock down. Use this for educational purposes only.
TATA INVESTMENT LOOKING AMAZING FOR 10-20% SOON1. Clear cut volume accumulation
2.Price sustaining at higher values
3.Triangle pattern visible
4.Breakout will lead to 10% move

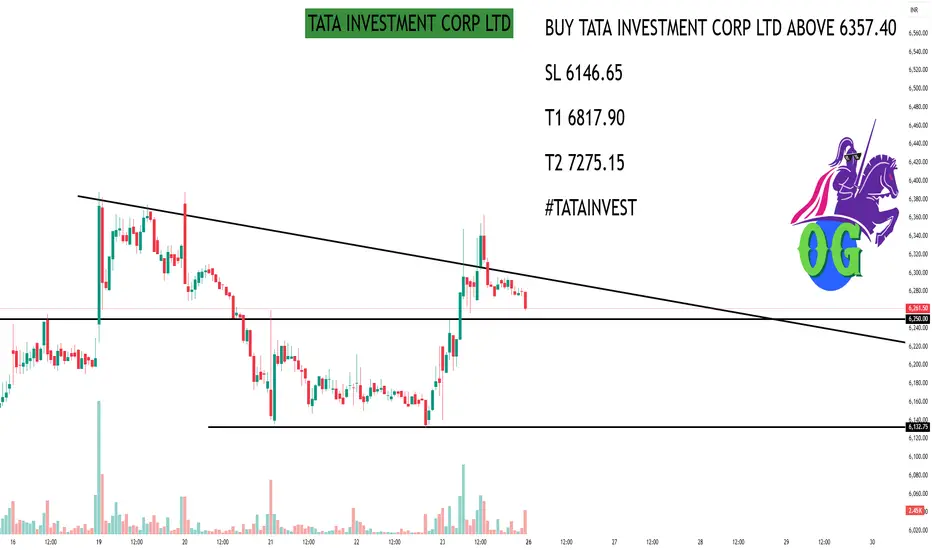
SWING (KEEP WATCH) - TATA INVESTScript showing high intraday momentum cleared trendline resistance now trading around 0.38 fib levels can head to next major swings resistance zone around 6500

SWING TRADE - TATA INVEST (KEEP WATCH)Script is showing good intraday momentum breakout supported by volumes above trendline in hourly timeframe.
Such strong moves have also happened in past so can be observed to scale above 7600 levels for continuation of move
SL can be last swing high in 15m timeframe

Tata Investment : about to Breakout Tata Investment after long consolidation It is about to Breakout
Buy near 6850-6925 stoploss 6600 tgt1 7100, tgt2 7300, tgt3 8140 tgt4 8683
when in profit trail your stoploss
Put Stoploss on closing basis.
(In Trading Time it may go above/below stoploss But closing price is most important).
These are levels are generated on the basis on Fibonacci Series
NOTE : I am not SEBI registered advisor in capital market.
Disclaimer:- Please always do your own analysis or consult with your financial advisor before taking any kind of trades. Please understand Risk in trading before taking any trade with your financial consult. I am only sharing my knowledge it may be right or sometimes wrong so I am not liable for any loss.
Dear traders, If you like my work then do not forget to hit like and follow me, and guy's let me know what do you think about this idea in comment box, i would be love to reply all of you guy's.
Thank you.

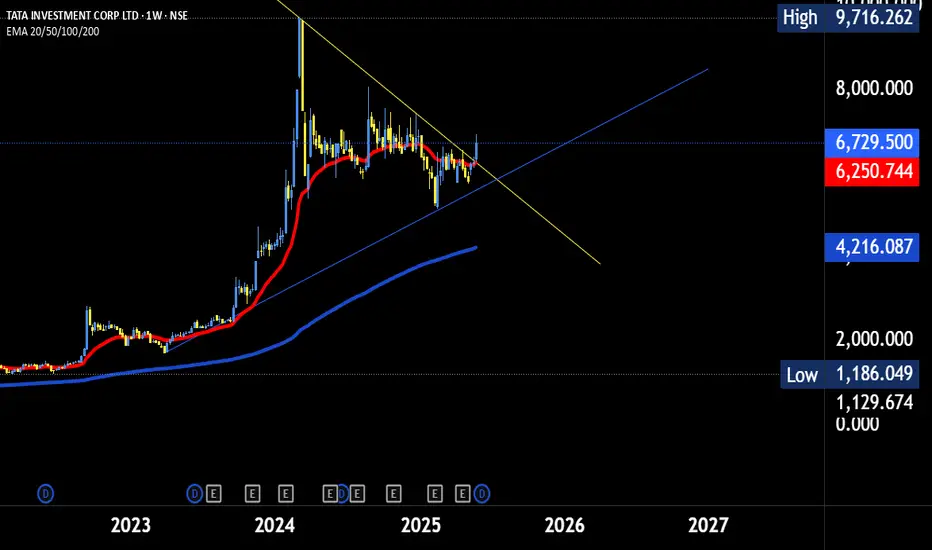
Tata Investment cmp 6894.85 by Weekly Chart viewTata Investment cmp 6894.85 by Weekly Chart view
- Volume way flattish by consolidation, need to increase
- Stock Price seems respecting the Rising Support Trendline
- Stock Price may attempt to break the Falling Resistance Trendline
- Price Band 5960 to 7590 Trading Range, Good Consolidation in progress
- Breakout from the Trading Price Range would provide fresh upside impetus

1% trade on TATA Invest around 6937 levelsA single stock can make you invest in Tata Group Companies its book value is around 6600 and once it starts sustaining above 6970 levels a long trade can be initiated with sl around 6880-6900 levels for a potential target of 7080++ 7150+++ 7270+++7450+++ and so on maintain proper sl as per your risk appetite

Tata invest at 7180 looks goodA long trade can be initiated in TAta investment share around 7180 level with strict sl around 6950-6900 levels for a target of 7800++ 8100+++ 8780+++ 9500+++ and so on.

TATAINVEST is near weekly /Daily Demand Zone good opportunity!!1. It is in pull back mode on Weekly/Daily charts
2. Tracking it for 6 Months to 1 year investing opportunity

Tata investment As just it as I expected it's breakout happened with good volume 🔥🎯 expecting next target is 10,000 above for long term 🎯🚀🔥

Tata investment As just it as I expected it's breakout happened with good volume 🔥🎯 expecting next target is 10,000 above for long term 🎯🚀🔥

Tata investment Volume Spike - Swing Tradelarge volume spike has been seen recently with a break of trend line
50% Buy @7377 & 50% Buy on dip 7000-7050 TG 8000,8400 SL 6900
Educational Ideas
To motivate us, Please like the idea If you agree with the analysis.

Tata investment Tata investment is ready for breakout if it is breakout happens stock may move 10,000 as target 🎯 previous high so let's wait for the proper trend breakout to entry setups 📈📉🚀

Tata investment Tata investment is ready for breakout if it is breakout happens stock may move 10,000 as target 🎯 previous high so let's wait for the proper trend breakout to entry setups 📈📉🚀

Tata Investment Corporation Ltd - Breakout Setup, Move is ON...#TATAINVEST trading above Resistance of 8793
Next Resistance is at 10596
Support is at 6095
Here are previous charts:
Chart is self explanatory. Levels of breakout, possible up-moves (where stock may find resistances) and support (close below which, setup will be invalidated) are clearly defined.
Disclaimer: This is for demonstration and educational purpose only. This is not buying or selling recommendations. I am not SEBI registered. Please consult your financial advisor before taking any trade.

Tata Investment Corporation Ltd - Breakout Setup, Move is ON...#TATAINVEST trading above Resistance of 7762
Next Resistance is at 8793
Support is at 5386
Here are previous charts:
Chart is self explanatory. Levels of breakout, possible up-moves (where stock may find resistances) and support (close below which, setup will be invalidated) are clearly defined.
Disclaimer: This is for demonstration and educational purpose only. This is not buying or selling recommendations. I am not SEBI registered. Please consult your financial advisor before taking any trade.

Tata Investment Corporation Limited - Long Setup, Move is ON...#TATAINVEST trading above Resistance of 6095
Next Resistance is at 7762
Support is at 4427
Here are previous charts:
Chart is self explanatory. Levels of breakout, possible up-moves (where stock may find resistances) and support (close below which, setup will be invalidated) are clearly defined.
Disclaimer: This is for demonstration and educational purpose only. This is not buying or selling recommendations. I am not SEBI registered. Please consult your financial advisor before taking any trade.

TATAINVESTMENT LearningsMarked recent three rallies followed by consolidation.
it has rallied 35% and above with in short span of time.
consolidated after rally for some long time.
moving averages cached up.
almost all the time respected 20 or 21 EMA.
most of the daily changes are less 2% during consolidation.
Price never fallen more than 15% from top, when moving to consolidation.
watchout for these characteristics to catch future rallying stocks to capture bigger gains, by spotting right entries.

TATAINVEST: Chart to Keep an Eye On!Overview:
TATAINVEST, after a considerable uptrend, gracefully navigated a consolidation phase and emerged with a breakout. Impressively, it's weathering the market fall, currently in the process of retesting key levels.
Key Points:
Uptrend Evolution: TATAINVEST exhibited a robust uptrend, reflecting positive momentum and investor confidence.
Consolidation Grace: Following the sustained rally, the stock gracefully entered a consolidation phase, setting the stage for its next move.
Breakout Tenacity: Defying market challenges, TATAINVEST successfully broke out, signaling renewed interest and potential for an extended uptrend.
Market Fall Resilience: Noteworthy is its ability to sustain breakout levels amidst broader market declines, positioning itself as a potential defensive asset.
Critical Retest: Currently, TATAINVEST is in the midst of a crucial retest, offering a glimpse into the strength of the breakout and potential future price action.
